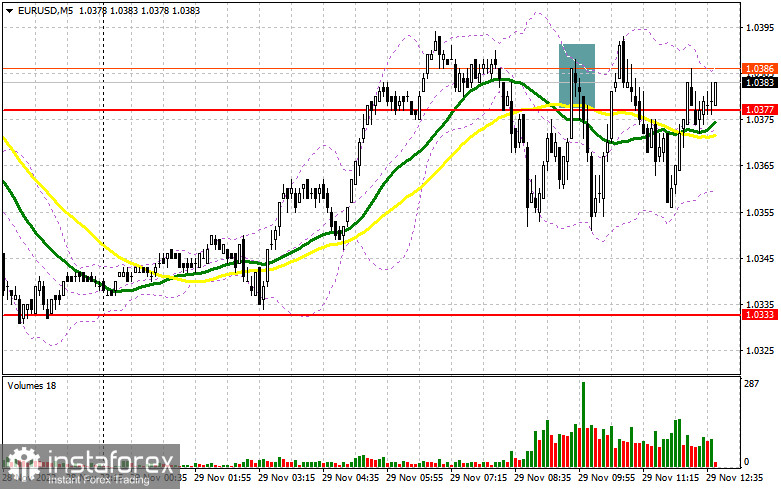
In my morning review, I mentioned the level of 1.0377 and recommended entering the market from there. Let's see what happened on the 5-minute chart. A rise to this level and its false breakout formed a sell signal in the first half of the day. After the pair had declined by 20 pips, bulls managed to regain control of the market. This allowed traders to close the trade at breakeven. At the moment, the pair is trading near the level of 1.0377 which is why we had to revise the technical setup for the second half of the day.
For long positions on EUR/USD:
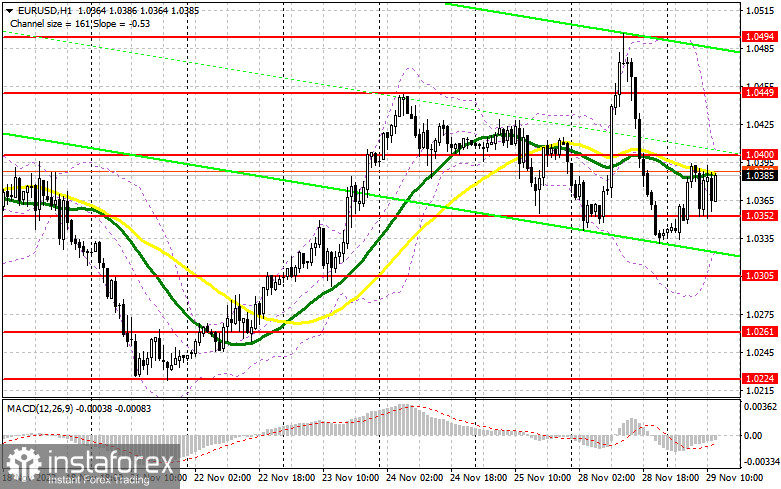
Most likely, the consumer confidence index and house prices in the US will influence the market sentiment in the second half of the day. The second indicator is of minor importance to the market. Yet, a possible decline in consumer confidence may affect the pair's trajectory. If consumer confidence falls below expectations, the euro may easily break through the nearest resistance zone of 1.0400 and return to monthly highs. In case the consumer confidence index comes in better than expected, risk assets will definitely come under pressure, pushing the euro/dollar pair lower. Therefore, traders should focus on the nearest support at 1.0352. Its false breakout will generate a buy signal and will help the pair retest 1.0400 where moving averages limiting the upside potential of the pair are located. A breakout of this range and its downward retest that was failed by the bulls in the early trade will reinforce the bullish bias and will pave the way towards 1.0449. If the price settles above this range, it may then develop a rise to the monthly high of 1.0494 where I recommend profit taking. If EUR/USD declines in the New York session and buyers are idle at 1.0352, traders will start taking profit at the end of the month, thus putting more pressure on the euro. If so, only a false breakout at the next support of 1.0305 will be a reason to buy the pair. Going long on EUR/USD right after a rebound is advisable only at the level of 1.0261 or at the low of 1.0224, keeping in mind a possible upside correction of 30–35 pips within the day.
For short positions on EUR/USD:
The best moment to sell the pair in the afternoon will be a false breakout at 1.0400. The pair may test this level at the moment when the fundamental data is published. This will create an entry point and a decline to the nearest support of 1.0352 that was formed in the morning. Consolidation near this range and its upward retest will create an additional sell signal with triggered stop-loss orders set by the bulls. In this case, the euro may drop to 1.0305 where I recommend profit taking. The level of 1.0261 will serve as the lowest target. If hit by the price, it may cancel the bullish trend. If EUR/USD moves up in the US trade and bears are idle at 1.0400, speculative sellers will start leaving the market. This will reinforce the bullish presence and will help them resume the uptrend by opening the way to 1.0449. At the same time, traders should keep in mind tomorrow's speech by Jerome Powell. By the way, yesterday's comments by Fed officials warning that the interest rate hike can be higher than 0.5% caused a rapid fall in the euro. As for today, the upside potential of the pair may be limited by expectations of a more hawkish stance of the Fed. Selling at 1.0449 can be done only after a false breakout. Going short on EUR/USD right after a rebound is advisable only from the high of 1.0494, bearing in mind a downward correction of 3–35 pips within the day.
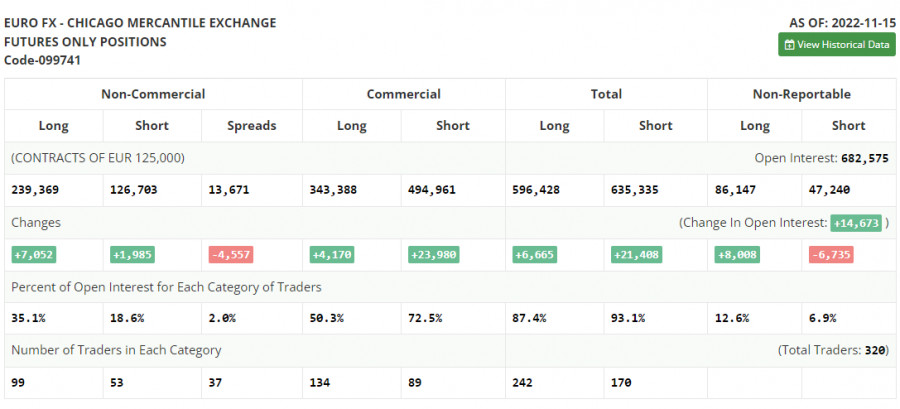
COT report
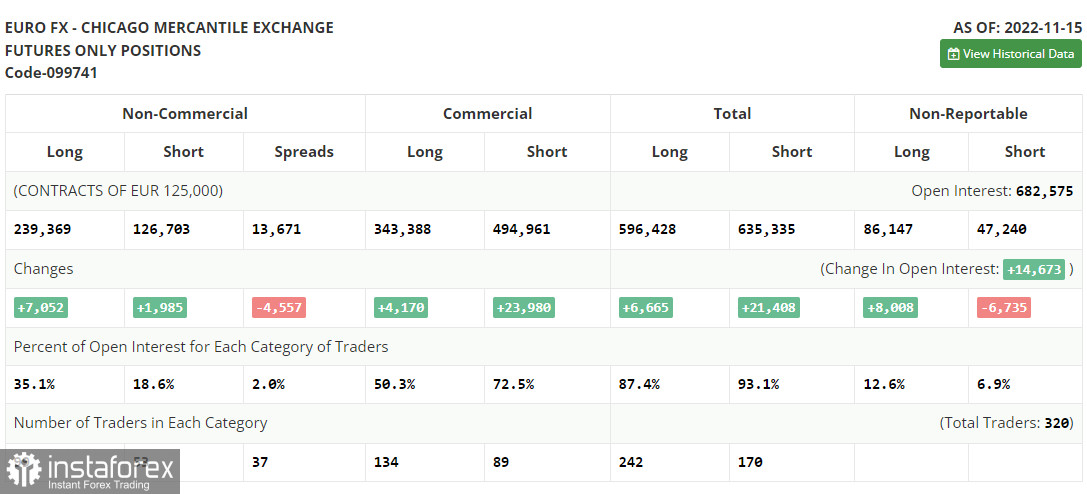
The Commitments of Traders report for November 15 showed a rise in both short and long positions. There have been speculations lately that the Fed may ease its current aggressive monetary policy starting this December. At the same time, these assumptions contrast with the recent US retail sales data revealing that the indicator increased in October. Moreover, the report has surpassed all forecasts, clearly indicating that inflationary pressures remain strong at the end of the year. Therefore, the recent CPI report from the US demonstrating a slowdown in prices should be taken with caution. Apparently, the US Federal Reserve will stick to its plan and will keep raising rates. As for the euro, the demand for risk assets has indeed increased. However, amid the recent GDP data in the eurozone, the euro/dollar pair is very unlikely to perform a strong upward movement until the end of the year. According to the COT report, long positions of the non-commercial group of traders increased by 7,052 to 239,369 while short positions rose by 1,985 to 126,703. The non-commercial net position remained positive and stood at 112,666 compared to 107,599 a week ago. This indicates that investors are taking advantage of a cheaper euro and continue to buy it even though it is holding above the parity level. They might also be accumulating long positions in hope that the pair will start to recover sooner or later. The weekly closing price advanced to 1.0390 from 1.0104.
Indicator signals:
Moving Averages
Trading above the 30- and 50-day moving averages indicates that bulls are prevailing in the market.
Please note that the time period and levels of the moving averages are analyzed only for the H1 chart, which differs from the general definition of the classic daily moving averages on the D1 chart.
Bollinger Bands
In case of a decline, the lower band of the indicator at 1.0333 will serve as support.
Description of indicators:
• A moving average of a 50-day period determines the current trend by smoothing volatility and noise; marked in yellow on the chart;
• A moving average of a 30-day period determines the current trend by smoothing volatility and noise; marked in green on the chart;
• MACD Indicator (Moving Average Convergence/Divergence) Fast EMA with a 12-day period; Slow EMA with a 26-day period. SMA with a 9-day period;
• Bollinger Bands: 20-day period;
• Non-commercial traders are speculators such as individual traders, hedge funds, and large institutions who use the futures market for speculative purposes and meet certain requirements;
• Long non-commercial positions represent the total number of long positions opened by non-commercial traders;
• Short non-commercial positions represent the total number of short positions opened by non-commercial traders;
• The non-commercial net position is the difference between short and long positions of non-commercial traders.