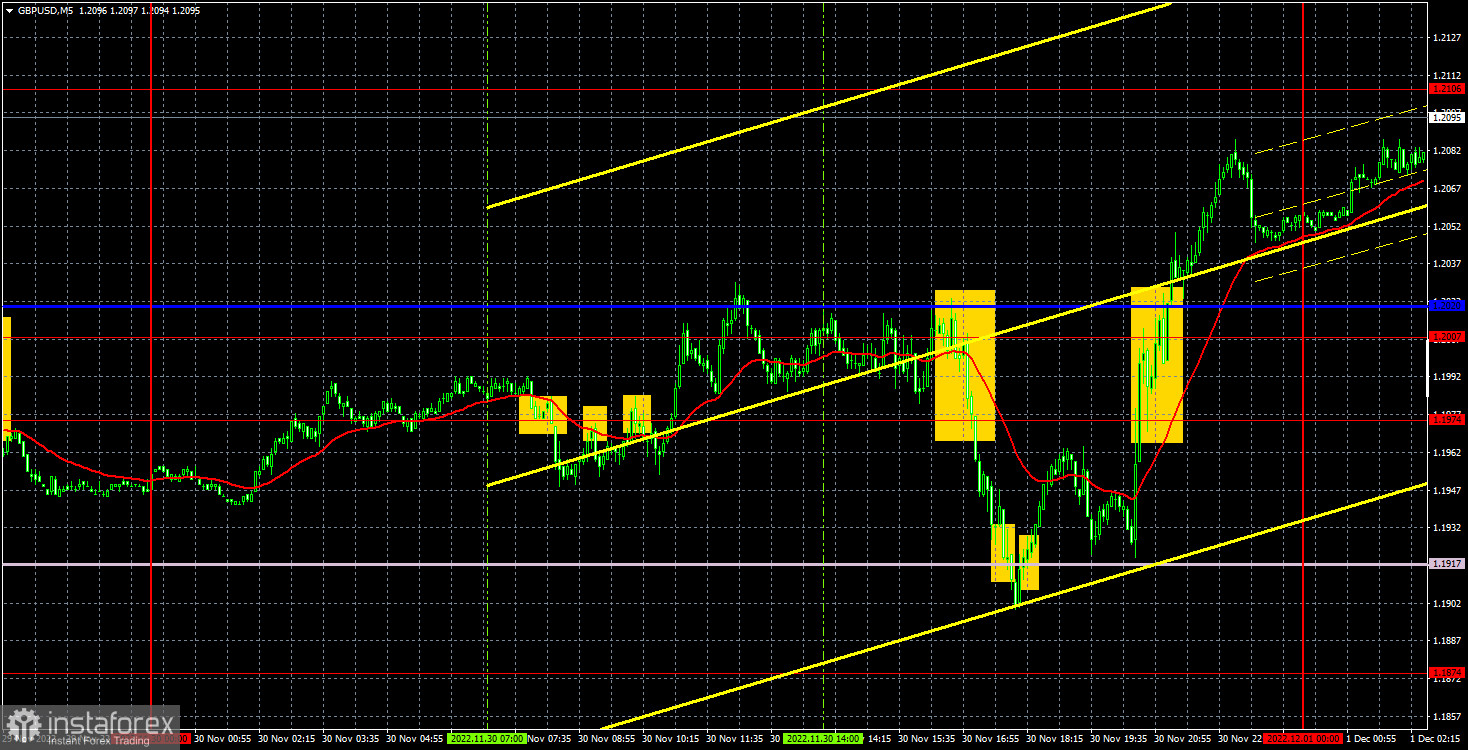
empty
 
 
01.12.2022 07:44 AM
Outlook and trading signals for GBP/USD on December 1. COT report. Analysis of market situation. Jerome Powell provoked the dollar's collapse.

M5 chart of GBP/USD

This image is no longer relevant

GBP/USD showed identical movements to EUR/USD on Wednesday. Traders worked out the U.S. reports, but they had a delayed reaction to them, and Federal Reserve Chairman Jerome Powell's speech in the evening did not provide any new information to traders, but they still started selling the US dollar again. I believe that the market is still not in a mood to sell, although the euro and pound have grown enough in recent weeks to correct. But as we said before, if there are no short positions, there is no downward movement. During the last days, the pair started hovering around the Senkou Span B and Kijun-Sen lines, which makes the current technical picture even more confusing. GBP ended the day near 1.2106 and even though the rally was not justified, we still expect a bearish correction. Today will be a little bit easier in terms of the fundamental background, but on Friday we anticipate a very significant report in the form of NonFarm Payrolls data, which can show negative dynamics.

As for trading signals, the situation was very complicated, but look at the nature of the pair's movement during the day! First, there were three sell signals near 1.1974, which duplicated each other. Only one short position had to be opened, and traders could close it almost anywhere. The fact is that the levels of 1.1974, 1.2007 and the Kijun-sen line were to be considered as an area. GBP did not settle above this area so there was no signal to cancel short positions. Formally, this short could be closed near the Senkou Span B line in profit. However, once again, such traders' actions were not obvious. The next buy signal in the form of GBP settling above the Senkou Span B could also bring profit, as the price at least returned to the level of 1.1974.
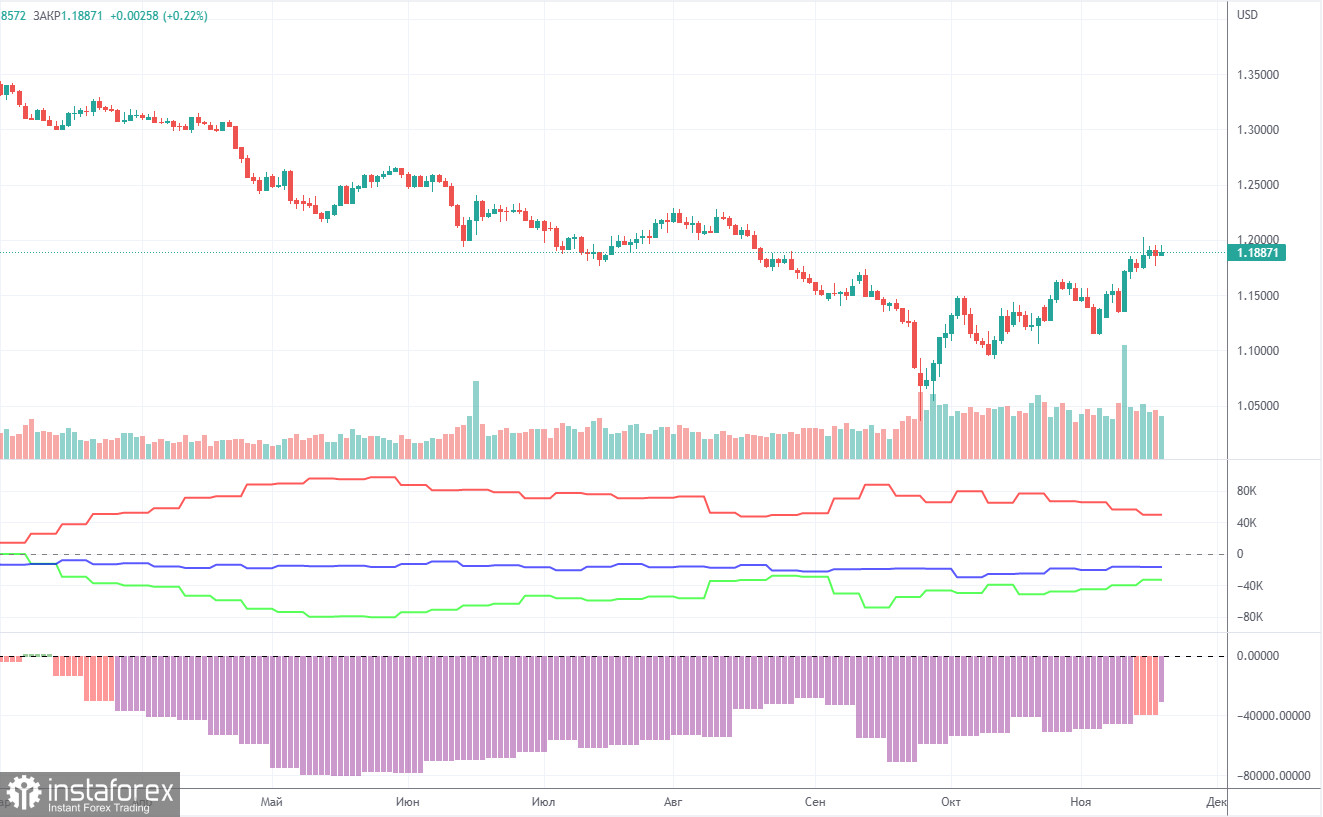
COT report

This image is no longer relevant

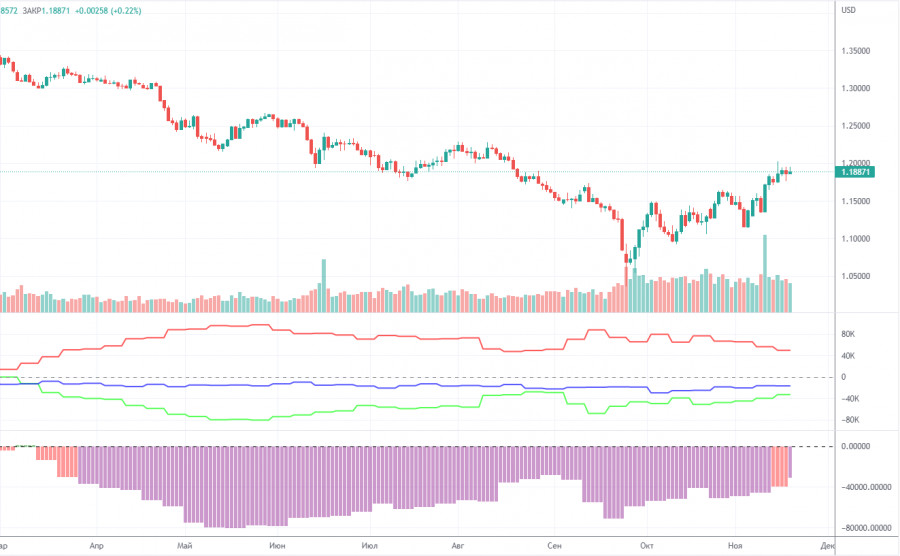
The latest Commitment of Traders (COT) report on GBP logged a slight decrease in bearish sentiment. In the given period, the non-commercial group closed 1,900 long positions and 8,800 short positions. Thus, the net position of non-commercial traders increased by 7,000. The net position is gradually growing during the last months, but the sentiment of the big players is still bearish. The pound has been rising in recent weeks, but so far it does not seem that it is preparing for a long-term uptrend. And, if we remember the euro's situation, then based on the COT reports, we can hardly expect a surge in price. The demand for the US currency remains very high, and the market, as it seems, is just waiting for new geopolitical shocks so it can return to buying the dollar. The non-commercial group now has a total of 67,000 shorts and 34,000 longs opened. As we can see, there is a wide gap between them. As it turns out the euro is now unable to show growth when market sentiment is bullish. When it comes to the total number of long and short positions, here bulls have an advantage of 17,000. Still, this is not enough for the sterling to increase. Anyway, we are still skeptical about the pound's long-term growth although the technical picture shows otherwise.
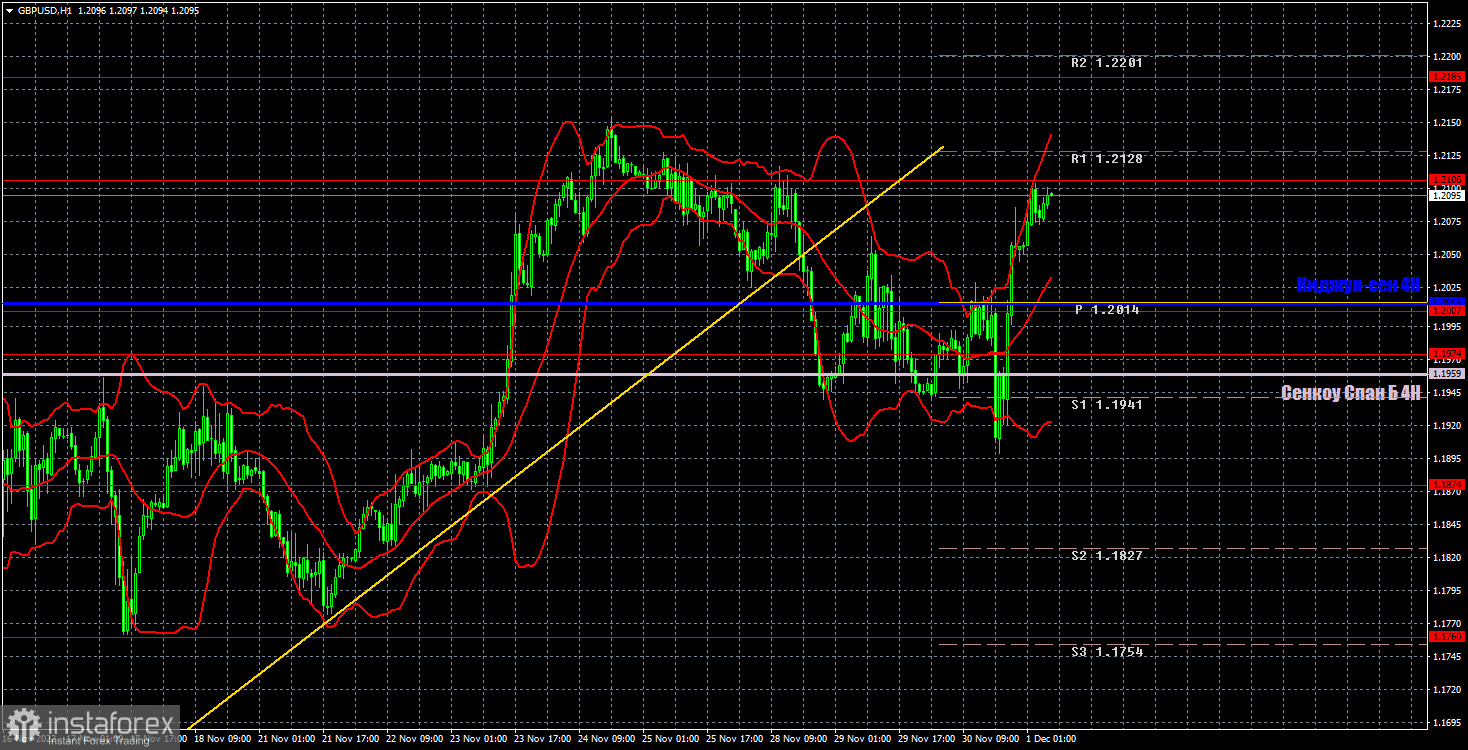
H1 chart of GBP/USD

This image is no longer relevant

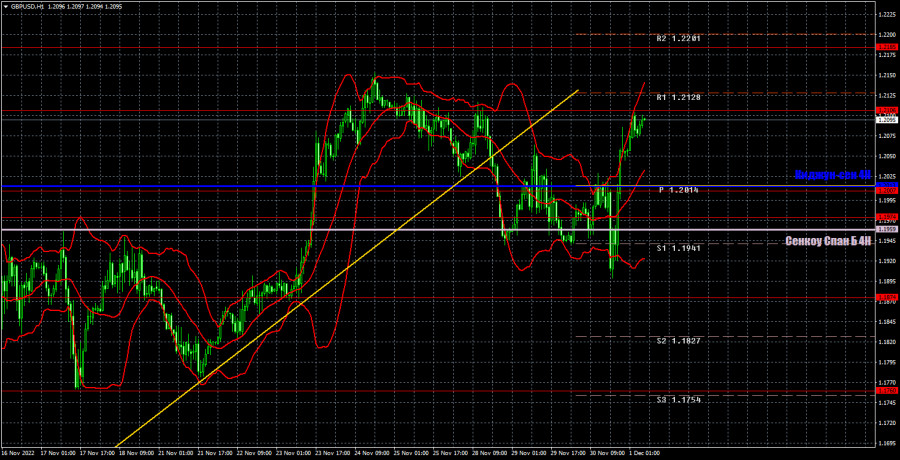
The pair started moving down on the one-hour chart, which we have been waiting for. It has crossed the trend line, so the uptrend is officially canceled. I believe that the pound may show a solid decline in the near future, but for now it needs to break through at least the Senkou Span B line and hope for support from this week's fundamental background. On Thursday, the pair may trade at the following levels: 1.1760, 1.1874, 1.1974-1.2007, 1.2106, 1.2185, 1.2259, 1.2342. The Senkou Span B (1.1959) and Kijun Sen (1.2013) lines may also generate signals. Pullbacks and breakouts through these lines may produce signals as well. A Stop Loss order should be set at the breakeven point after the price passes 20 pips in the right direction. Ichimoku indicator lines may move during the day, which should be taken into account when determining trading signals. In addition, the chart does illustrate support and resistance levels, which could be used to lock in profits. On Thursday, the UK is scheduled to release an index of business activity, while the US will release important ISM indexes for services and manufacturing. Today could also be a volatile day.

What we see on the trading charts:

Price levels of support and resistance are thick red lines, near which the movement may end. They do not provide trading signals.

The Kijun-sen and Senkou Span B lines are the lines of the Ichimoku indicator, moved to the one-hour chart from the 4-hour one. They are strong lines.

Extreme levels are thin red lines from which the price bounced earlier. They provide trading signals.

Yellow lines are trend lines, trend channels, and any other technical patterns.

Indicator 1 on the COT charts reflects the net position size of each category of traders.

Indicator 2 on the COT charts reflects the net position size for the non-commercial group.

Paolo Greco,
Esperto analista di InstaForex
© 2007-2023
EURUSD
Euro vs US Dollar
Select timeframe
5
min
15
min
30
min
1
hour
4
hours
1
day
1
week
Start trade
Start trade
  • Grand Choice
    Contest by
    InstaForex
    InstaForex always strives to help you
    fulfill your biggest dreams.
    JOIN CONTEST
  • Chancy Deposit
    Deposit your account with $3,000 and get $8000 more!
    In March we raffle $8000 within the Chancy Deposit campaign!
    Get a chance to win by depositing $3,000 to a trading account. Having fulfilled this condition, you become a campaign participant.
    JOIN CONTEST
  • Trade Wise, Win Device
    Top up your account with at least $500, sign up for the contest, and get a chance to win mobile devices.
    JOIN CONTEST
  • 100% Bonus
    Your unique opportunity to get a 100% bonus on your deposit
    GET BONUS
  • 55% Bonus
    Apply for a 55% bonus on your every deposit
    GET BONUS
  • 30% Bonus
    Receive a 30% bonus every time you top up your account
    GET BONUS

Recommended Stories

EUR/USD: piano per la sessione europea del 13 marzo. Rapporti COT Commitment of Traders (analisi delle operazioni di ieri). L'euro è in forte rialzo dopo il rapporto sulla variazione dell'occupazione non agricola (Non-Farm Employment Change)

Venerdì si sono formati diversi segnali di ingresso nel mercato. Vi suggerisco di dare un'occhiata al grafico a 5 minuti e capire cosa è successo. Nelle mie previsioni mattutine

Miroslaw Bawulski 07:49 2023-03-13 UTC+2

GBP/USD: piano per la sessione europea del 13 marzo. Rapporti COT Commitment of Traders (analisi delle operazioni di ieri). La sterlina è tornata ai massimi di febbraio

Venerdì si sono formati diversi segnali di ingresso nel mercato. Vi suggerisco di dare un'occhiata al grafico a 5 minuti e capire cosa è successo. Nelle mie previsioni mattutine

Miroslaw Bawulski 07:49 2023-03-13 UTC+2

Come scambiare la coppia di valute EUR/USD il 27 febbraio? Semplici suggerimenti e analisi delle transazioni per i principianti.

La coppia di valute EUR/USD ha continuato il suo movimento al ribasso venerdì e ha facilmente superato il livello di 1,0587. Il canale discendente continua a indicare una tendenza

Paolo Greco 08:16 2023-02-27 UTC+2

Come scambiare la coppia di valute GBP/USD il 27 febbraio? Semplici suggerimenti e analisi delle transazioni per i principianti.

Anche la coppia GBP/USD ha continuato il suo movimento al ribasso venerdì dopo aver superato la linea di tendenza ascendente. Pertanto, sia il segnale tecnico che il contesto fondamentale hanno

Paolo Greco 08:16 2023-02-27 UTC+2

Piano di trading per EUR/USD e GBP/USD il 21/02/2023

Dopo la stagnazione di ieri, oggi il mercato si riprenderà in qualche modo grazie alla pubblicazione di stime preliminari degli indici di attività delle imprese, ma alla fine questo

Mark Bom 09:55 2023-02-21 UTC+2

Impariamo e analizziamo, un piano di trading per i trader principianti su EURUSD e GBPUSD 20.02.23

I dati sulle vendite al dettaglio di venerdì nel Regno Unito hanno mostrato un rallentamento del ritmo del declino dal -6,1% al -5,8%. Vale comunque la pena considerare

Gven Podolsky 11:17 2023-02-20 UTC+2

Impariamo e analizziamo, un piano di trading per i trader principianti su EURUSD e GBPUSD 17.02.23

I dati sulle domande di disoccupazione negli Stati Uniti riflettono un aumento del loro volume totale. Questo è un fattore negativo per il mercato del lavoro statunitense. Dettagli statistici

Gven Podolsky 09:24 2023-02-17 UTC+2

GBP/USD: piano per la sessione europea il 31 gennaio. Rapporti COT Commitment of Traders (analisi delle operazioni di ieri). La sterlina rischia di rimanere bloccata nel canale laterale

Ieri non c'erano segnali per entrare nel mercato. Diamo un'occhiata al grafico a 5 minuti e vediamo cosa è successo. Al mattino, in un contesto di bassa volatilità

Miroslaw Bawulski 09:17 2023-01-31 UTC+2

EUR/USD: piano per la sessione europea il 31 gennaio. Rapporti COT Commitment of Traders (analisi delle operazioni di ieri). L'euro non è riuscito a raggiungere i massimi mensili

Ieri si sono formati diversi segnali di ingresso nel mercato. Vi suggerisco di dare un'occhiata al grafico a 5 minuti e capire cosa è successo. Nelle mie previsioni mattutine

Miroslaw Bawulski 09:16 2023-01-31 UTC+2

Piano di trading per EUR/USD e GBP/USD il 31/01/2023

Diciamo pane al pane: il mercato segna il passo. Ma comunque all'apertura della sessione di negoziazione americana, la sterlina ha iniziato a diminuire. E ha continuato a perdere posizioni durante

Mark Bom 08:59 2023-01-31 UTC+2
In questo momento non potete parlare al telefono?
Ponete la vostra domanda nella chat.