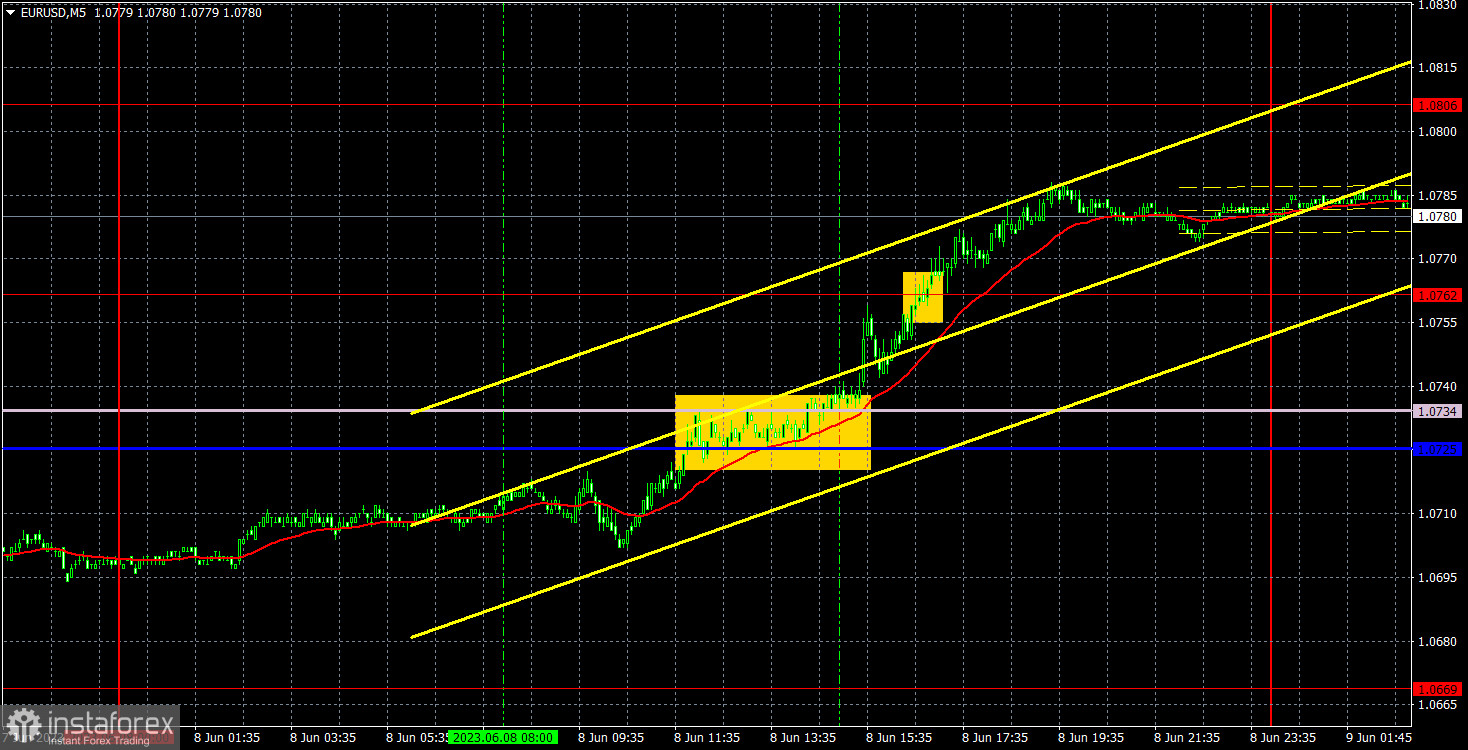
5M chart of EUR/USD
EUR/USD gained almost 100 pips on Thursday. The pair started moving up in the evening and had no apparent basis throughout the day. The market simply decided to buy the euro at a certain point, leading to a significant increase. The situation is made more interesting by the report on GDP for the first quarter of the European Union, which came in below expectations and indicated an economic decline. However, the market paid no attention to it and continued buying as if nothing happened. That's all you need to know about the logic of the movements. The pair has risen to its recent local peak, but there were no reasons for growth, and there still aren't. It wouldn't be surprising if the pair reverses direction today.
Speaking of trading signals, yesterday's situation turned out well because we witnessed strong movement in one direction throughout the day. The first buy signal formed when the Ichimoku indicator lines were surpassed. Subsequently, the price also broke above the level of 1.0762, and there were no sell signals by the end of the day. Therefore, the only buy position should have been manually closed in the evening, resulting in a profit of at least 40 pips.
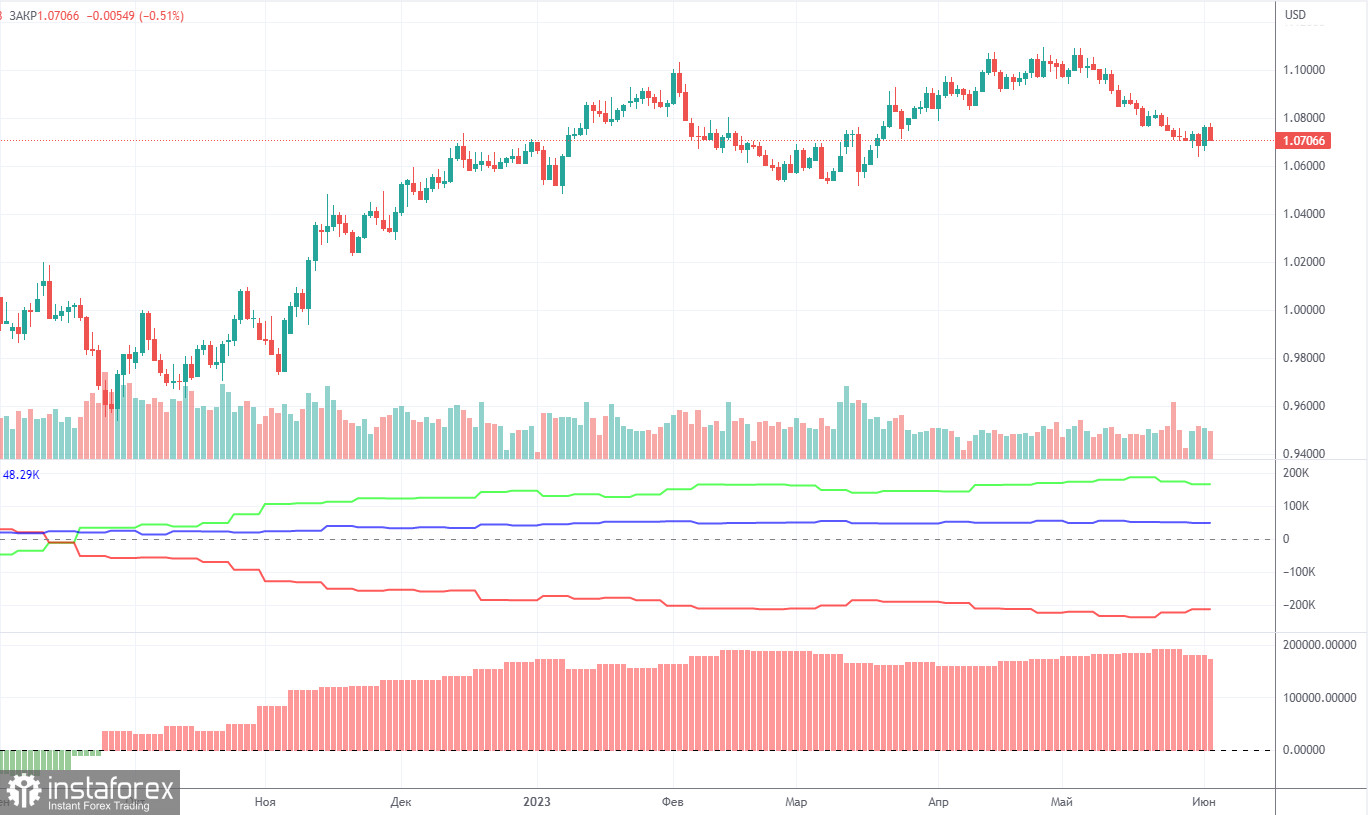
COT report:
On Friday, a new COT report for May 30 was released. In the last 9 months, COT reports have fully corresponded to what is happening on the market. The chart above clearly shows that the net position of big traders (the second indicator) began to grow again in September 2022. At the same time, the euro resumed an upward movement. The net position of non-commercial traders is bullish. The euro is trading at its highs against the US dollar.
I have already mentioned that a fairly high value of the "net position" indicates the end of the uptrend. The first indicator also signals such a possibility as the red and green lines are very far from each other. It often occurs before the end of the trend. The euro tried to start falling a few months ago but there was only a pullback. During the last reporting week, the number of long positions of the "Non-commercial" group of traders decreased by 8,200, and the number of short positions – by 200. The net position tumbled by 8,000. The number of long positions is higher than the number of short ones. Non-commercial traders opened 165,000 long positions. This is a very large gap. The difference is more than three times. The correction has begun. Yet, it may not be a correction but the start of a new downtrend. At this time, it is clear that the pair is likely to resume a downward movement without COT reports.
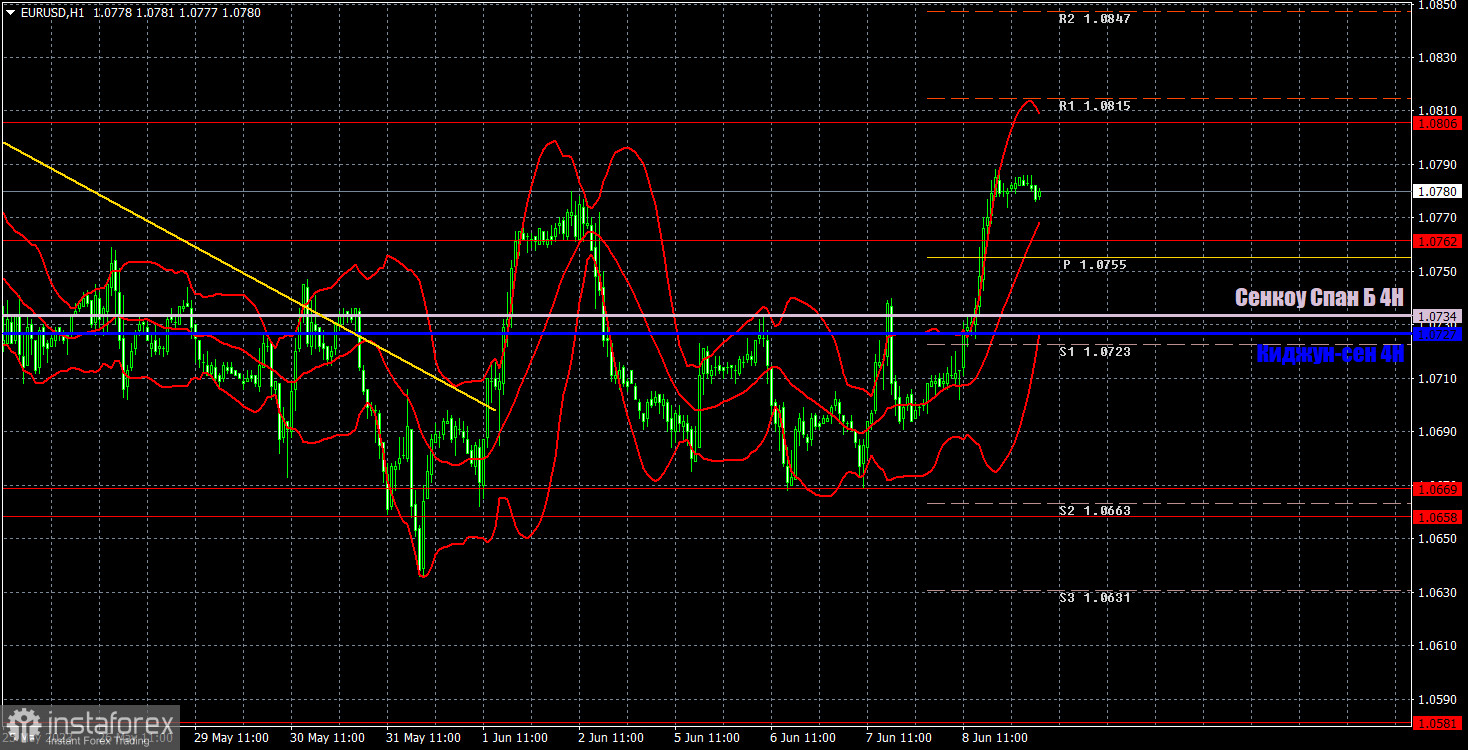
1H chart of EUR/USD
In the 1-hour chart, the pair broke through the descending trend line and is still trying to start a corrective growth. However, the pair has no drivers for growth, so we believe that the downtrend will resume. Of course, there will be important events next week, like the US inflation report or the Federal Reserve meeting. After these events, the pair can move in either direction. However, we still believe that the downward movement is the most logical and justified scenario.
On June 9, trading levels are seen at 1.0537, 1.0581, 1.0658-1.0669, 1.0762, 1.0806, 1.0868, 1.0943, 1.1092, as well as the Senkou Span B (1.0734) and Kijun-sen (1.0727) lines. Ichimoku indicator lines can move intraday, which should be taken into account when determining trading signals. There are also support and resistance although no signals are made near these levels. Signals could be made when the price either breaks or bounces from these extreme levels. Do not forget to place Stop Loss at the breakeven point when the price goes by 15 pips in the right direction. In case of a false breakout, it could save you from possible losses.
Today, the eurozone will release its retail sales report, which is not particularly significant on its own. None scheduled for the US. Most likely, we should brace ourselves for weak movements and a vague trend.
Indicators on charts:
Resistance/support - thick red lines, near which the trend may stop. They do not make trading signals.
Kijun-sen and Senkou Span B are the Ichimoku indicator lines moved to the hourly timeframe from the 4-hour timeframe. They are also strong lines.
Extreme levels are thin red lines, from which the price used to bounce earlier. They can produce trading signals.
Yellow lines are trend lines, trend channels, and other technical patterns.
Indicator 1 on the COT chart is the size of the net position of each trader category.
Indicator 2 on the COT chart is the size of the net position for the Non-commercial group of traders.