


One of the most relevant skills of forex market participants is the ability to choose the best moment for opening and closing a trade. Some traders use their intuition for this.
However, a more reliable way to determine entry points is to conduct technical analysis. It is carried out using best Forex indicators, which we will discuss in this article.
On the one hand, indicators are a simple and easy-to-use tool. On the other hand, they may not bear fruit if used incorrectly.
You will find out what indicators are, what their types are, and what each of their types is intended for. Besides, you will learn how to apply them correctly so that you can make a profit.
What are Best Forex indicators?
Technical indicators are made up of mathematical formulas embedded in their programs, which analyze price changes on trading charts. A unique formula is built into each of the indicators.
That is why there are many different indicators that are used for different purposes. Forex Level indicators determine the area in which the price of an asset is moving. Some help traders identify the direction of the trend. Others indicate possible points of a trend change, and so on.
All indicators are based on four key parameters: price highs and lows as well as opening and closing prices. Time frames are also taken into account.
To obtain data for building indicators, candlesticks are used on trading charts. However, it should be noted that indicators analyze past changes in quotes.
This implies the usage of those candlesticks that are already closed. Further, with the help of this information, you can try to predict further dynamics in the market.
However, the readings of an indicator may not be entirely correct and may be delayed. Therefore, traders are recommended to apply several indicators at once on one chart.
They will interact with each other, complementing and filtering each other's signals. This will help you make the right trading decision based on a more balanced assessment.
In addition to indicator analysis, it is worth conducting fundamental analysis, which helps determine the impact of global economic and political events on the market.
Indicators cannot take into account this data as their calculations are based solely on certain mathematical formulas.
Market analysis is one of the most difficult tasks for traders since it requires considering a large number of factors and studying vast amounts of information.
Working principle
Technical indicators were developed quite a long time ago, back in the last century. Initially, all calculations were carried out manually.
At present, we can use computer capabilities to conduct technical analysis of the market.
Thanks to the fact that calculations are carried out by a computer, you can receive ready-to-use data. That is why MT4 indicators have become very popular among traders.
The working principle of most indicators is to make calculations based on the formula embedded in them and provide traders with a corresponding signal.
In addition, it is necessary to understand that different types of indicators are suitable for different market conditions. For instance, some of them are more effective when the market is range-bound, while others are completely useless in such a situation.
Thus, before using an indicator, you need to find out what is happening in the market. This can be figured out, among other things, by means of fundamental analysis.
To correctly apply an indicator, it is also necessary to understand its operation algorithm by studying a formula. You need to be aware of which factors may lead to false signals.
Metrics can be customized to your needs by changing time frames and other settings. This makes an indicator more or less sensitive to price fluctuations.
At the same time, price fluctuations on short timeframes occur quite often, which may lead to the so-called price noise. This is why analysis in short time frames may provide traders with false signals.
However, you need to keep in mind that indicators do not predict future market behavior. They rather analyze the current market dynamics based on historical data. Forecasts regarding further price movements can be made by traders themselves.
As a rule, technical indicators are used by those traders who prefer short- and medium-term investments. For traders who opt for long-term trading, technical analysis is of less interest.
Advantages and disadvantages
The use of indicator analysis has both its pros and cons. To begin with, let's take a detailed look at the positive aspects of using technical indicators:
- Visual component. The indicators reflect the market situation. They are added directly onto the price chart and interact with it.
- The ability to use several indicators at once on one chart allows traders to get a more objective picture.
- Ease of use. All calculations are made automatically by a computer program, and traders get a ready-made solution.
- Ability to receive specific signals. Indicators provide traders with signals to open or close a trade, which facilitates the decision-making process.
Now let’s consider the negative aspects of using indicators:
- Delays. Many indicators provide signals with a delay as calculations are based on past quotes. However, this problem can be solved by using indicators from several groups at the same time.
- False signals. Indicators can provide false signals in some cases, for example, in the event of market noise in short time frames. To address this problem, you can conduct analysis on several charts, using different time frames, and thus get a more objective picture.
- Incomplete analysis. As we have already mentioned, indicators ignore news or political factors. All this can be taken into account only by fundamental analysis. Thus, the problem can also be solved by using both technical and fundamental analysis.
Types of technical indicators
All indicators serve different functions as they are based on different formulas. However, there are some features that allow users to put them into groups according to various criteria.
The main feature of dividing indicators into types is what exactly they analyze. Thus, the following types are distinguished:
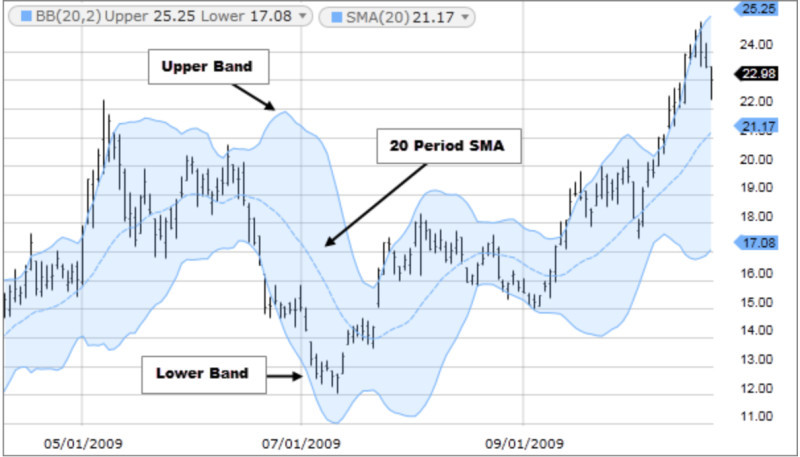
1. Trend indicators make it possible to identify in which direction the price of an asset is moving. However, one of the significant weak points of this category is the high probability of delayed signals. This category includes moving averages, Bollinger bands, and others.
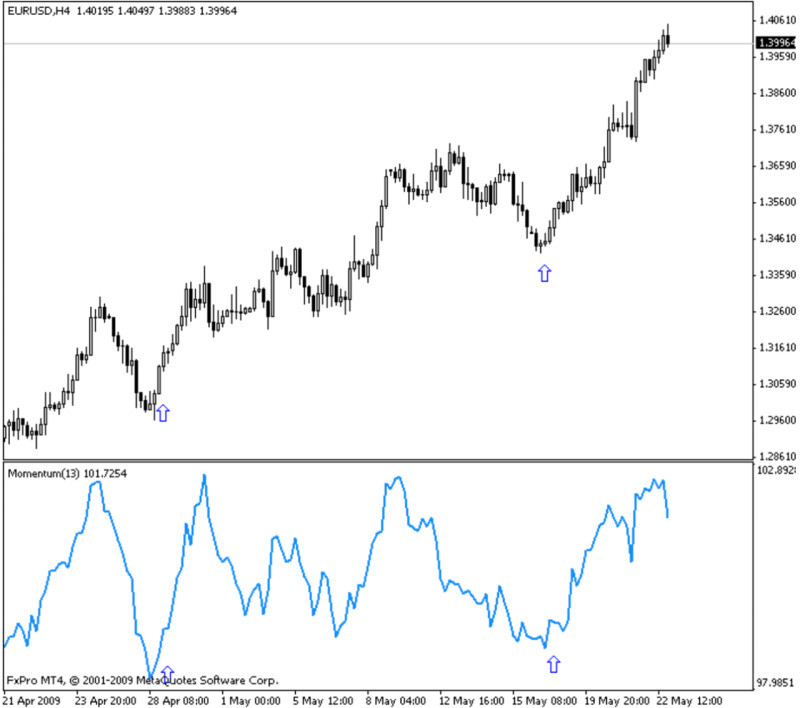
2. Oscillators are considered leading indicators. This type of technical tool makes it possible to identify the ratio of supply and demand for the selected asset. Oscillators are typically used in conjunction with trend indicators. This group includes the Relative Strength Index (RSI), Stochastic, momentum indicator, and others.
3. Volume indicators measure the total number of transactions for a particular asset. The forex market does not reflect real but tick volume. Among the representatives of this type are On-balance volume, MFI indicator, Horizontal Volume Indicator, and others.
4. Sentiment indicators allow traders to determine the general mood of market participants. They do not provide them with specific signals for making trades. However, they help get a more objective view of the situation in the market. Consensus and commitment indicators fall into this category.
5. Bill Williams’ indicators are included in a separate category. This is a group of tools created by Williams based on the idea that moves in the forex market are chaotic. Therefore, template analysis methods cannot produce good results. This category includes fractals, Alligator, Awesome Oscillator, and others.
Also, indicators can be divided into types depending on their availability:
- Public indicators are a standard set of indicators that can be downloaded for free to your trading platform;
- Copyright indicators are usually paid indicators developed by successful traders based on their own experience.
Forex Trend Indicators
The direction of movement of the asset’s price can be ascending or descending. In addition, there may be a sideways movement, which is also called a flat.
An uptrend is evidenced by successive price highs that gradually increase, while successively decreasing lows indicate a downtrend.
Many trading systems are based on trend trading. There is even a well-known expression in financial markets: "The trend is your friend."
However, to successfully use the price trend, you need to determine it correctly. That is why this group of indicators exists.
As we have already mentioned, forex trend indicators make it possible to determine the strength and direction of movement of the asset’s price. This is one of the simplest and most commonly used indicators.
They also form the basis of the indicators included in other groups. You can apply several indicators from this group on one chart, or you can combine them with indicators of other types.
The VWAP indicator is used to calculate the volume-weighted average price. It is based on moving averages and takes into account not only the average price but also trading volumes.
The most widely used representative of this category is the moving average (MA). It calculates the average price of an asset over a certain period of time.
The main varieties are simple and exponential moving averages, but there are also other types.
At the same time, this indicator can be used on a chart with different time frames. The most commonly used ones are the 20 EMA (short time frames) and the 200 EMA (long time frames).
What are oscillators? What are they for?
Oscillators differ from other types of indicators in that they do not constantly follow the trend. More precisely, they help traders work in the market when it moves sideways.
Oscillators measure the amount that an asset's price has changed over a given period of time. These indicators produce signals in the range of 0 to 100.
They are used to identify in which direction the price of an asset will move: whether it will further follow the trend, or reverse and start moving in the opposite direction.
Furthermore, their distinctive feature is that they allow traders to find overbought and oversold territories.
Overbought is a term used when the price of an asset reaches the upper boundary of the range. It reflects an expectation that the market will hardly go up further. Overbought conditions occur when buyers are no longer willing to buy an asset at a certain price.
Oversold is a term used when the price reaches the lower boundary of the range and is unlikely to continue to fall. Oversold conditions occur when sellers are not ready to sell at a certain price.
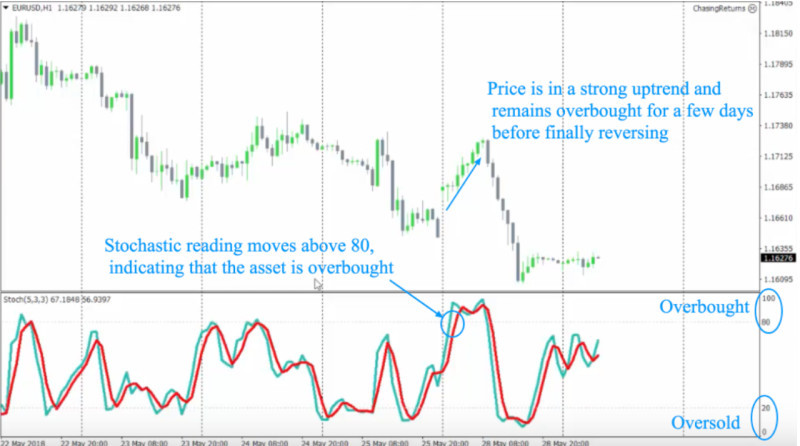
As for the range, the market is considered overbought when the price is above the levels of 75-80 and oversold when the price is below the levels of 20-25.
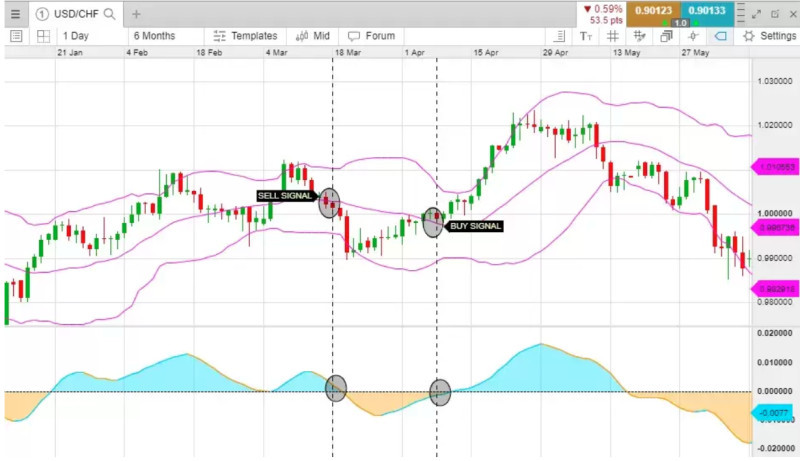
If the oscillator falls below the oversold zone and then breaks through this level upwards, a buy signal is generated. If the indicator rises above the overbought zone and then breaks through this boundary downwards, a sell signal comes.
Another way to use representatives of this type is to find divergences and convergences, that is, discrepancies between the price on the chart and the indicator readings.
Such divergences indicate a weakening trend and even a possible imminent trend change.
Volume Indicators
Volumes vary depending on market types. Thus, stock markets are based on real volumes, that is the total number of transactions for an asset.
The peculiarity of the Forex market is that it is based on tick volumes rather than real volumes. This refers to the number of ticks, that is, fluctuations in value over a certain period of time.
In this regard, some traders do not use Forex Volume indicators in trading at all. However, some of them can be quite useful.
At the same time, there is a correlation between real and tick volumes. In periods when the number of transactions increases, the number of price fluctuations increases as well.
Accordingly, tick volumes change following changes in real volumes.
At the same time, they can be displayed both in the form of a single line and, like oscillators, in the form of columns limited by the minimum and maximum thresholds.
However, regardless of the display method, there are several principles of working with this group of indicators that traders can use:
- A decrease in volumes indicates lower demand for a particular asset from market participants, which subsequently leads either to consolidation or a trend change.
- An increase in volumes indicates higher demand for a particular asset, which means a strengthening trend or sharp change in the price direction.
- A slow decline suggests that major players have left the market, but a large number of retail traders continue to influence the market.
- Peaks indicate a high probability of a trend reversal.
Psychological Indicators
There is an opinion that stock markets as well as the forex market are subject to strict economic laws. However, the main participants in these markets are people who are prone to excessive emotionality and cannot always make informed decisions.
There is no denying that rumors, assumptions, and expectations of market participants have a huge impact on markets.
In addition to political and economic events, traders must take into account psychological factors.
They are especially relevant on the eve of the release of important news that could have a severe impact on the situation.
During such periods, experts and analysts become especially active, predicting what changes are ahead and what impact they may have on the current situation.
For example, the US Federal Reserve’s interest rate decision as well as reports on inflation or GDP growth are of great importance.
Experts provide traders with their forecasts, which are often based on "information from sources close to ...". Although their predictions are not always accurate, they still have an impact on markets even before the release of the news.
If interest rates are forecast to be lifted, market participants perceive this as a sign of tighter monetary policy.
Such rumors make investor sentiment more pessimistic. This in turn leads to a decline in major stock indices, as well as currencies and currency pairs.
Therefore, the impact of psychological factors on traders’ behavior should not be underestimated. Markets price in potential changes even before they happen.
Bill Williams Indicators
Bill Williams is an author of several books, who developed his own trading method. Besides, he is a successful trader with great teaching experience as a trading educator.
His theory is that the market moves chaotically and it is quite difficult to detect any patterns in price movements. Also, Williams believes that the behavior of market participants is largely driven by psychological factors.
One of the most widely used indicators of this group is the Awesome Oscillator. It is based on two moving averages (short-term and long-term), which are compared with each other in order to determine the general mood of the market.
The Williams Alligator and fractal indicators are also very popular. The Alligator indicator uses three SMAs with different periods. In fact, it is a trend indicator.
Fractals make it possible to determine the highest and lowest marks using a pattern that comprises five candles. This indicator does not provide signals for entering the market but works well in conjunction with the Alligator indicator.
All indicators of Bill Williams are widely available and can be used by traders for free. At the same time, they still have not lost their relevance and remain in demand.
Notably, there are no effective advisers or robots based on Williams’ indicators.
In addition, bear in mind that these best Forex indicators are more suitable for stock markets. To apply them in the forex market, it is necessary to make some improvements.
Profitable non-repainting forex indicators
For successful trading, a trader needs to find and apply indicators that provide the most correct data. Lagging indicators may lead to inaccurate signals.
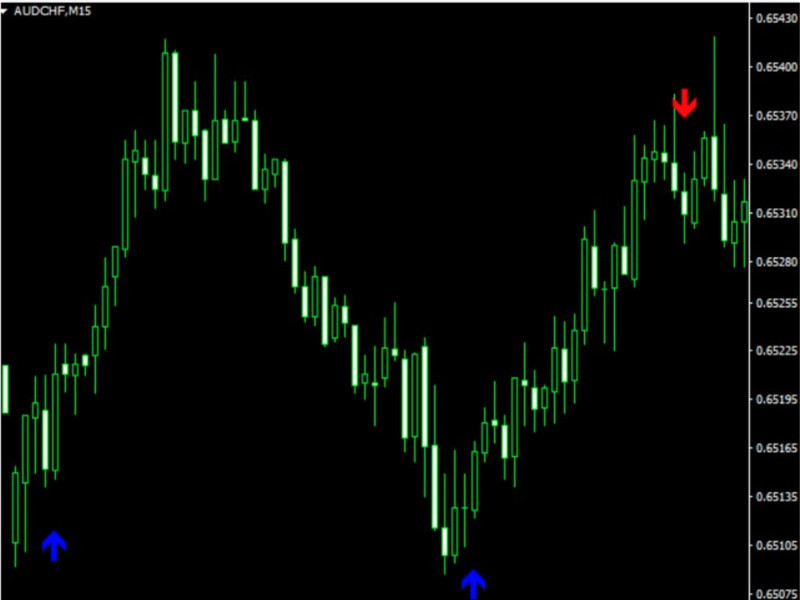
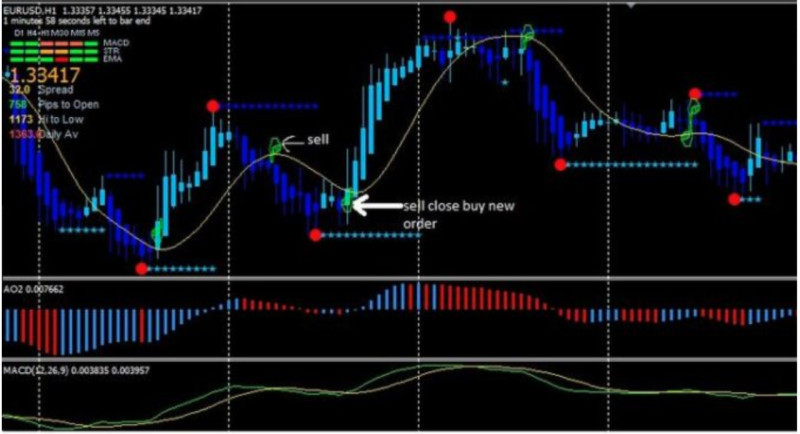
Forex arrow indicators differ from others in that they overlay directly on the trading chart. Arrows are used to determine the entry and exit points of a trade.
Such signals are quite obvious. Therefore, they are particularly suitable for novice traders who find it difficult to determine entry and exit points.
However, keep in mind that the arrows can move when the market situation changes. This is called repainting. That is, an indicator changes its values on the chart when new data arrives.
Such movements confuse traders and do not allow them to make the right decision to open or close a trade.
That is why traders are recommended to use non-repainting indicators. They do not change their values and do not get users into a mess.
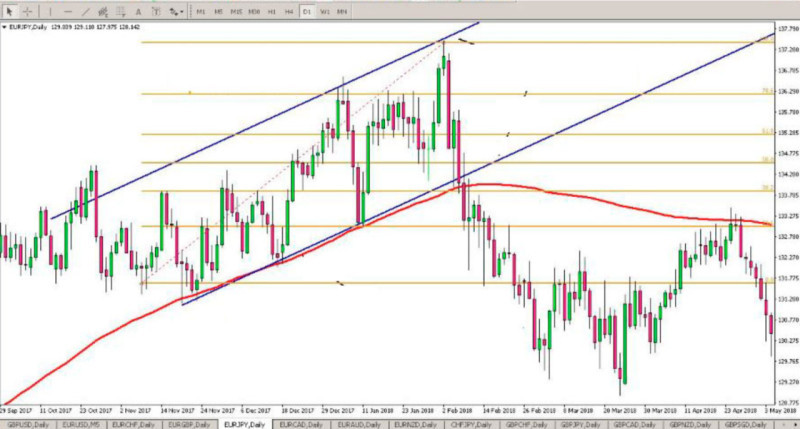
A prime example of such indicators is Fibonacci retracement levels, an indicator based on Leonardo Fibonacci's numbers. These horizontal lines are drawn on the chart at a certain distance from each other.
The distance between the lines is calculated using a special formula and does not change. This is the reason why the indicator is not repainted after being applied to the trading chart.
As mentioned earlier, indicators work best in tandem. Therefore, to obtain more accurate signals, we recommend using several indicators at once on one chart.
Their values will complement each other. In this case, it will be possible to see a bigger picture of what is happening in the market. All this together will give you a better understanding of entry and exit points.
Strategies that require indicators
To achieve financial success in the forex market, a trader needs to follow the rules of a certain trading system. Traders who do not stick to a trading system make spontaneous trades and often suffer losses.
Of course, your trades can be successful without a strategy, but their percentage will be clearly lower.
This is due to the fact that a strategy forces traders to adhere to clearly established rules. They determine the best moments to enter and exit a transaction, risk levels, lot sizes, and so on.
The very fact a trading system is needed is undeniable. However, each trader can choose or develop a strategy that best suits his/her preferences.
There are several types of trading algorithms:
- Indicator ones, as the name implies, use technical metrics to receive signals to open and close transactions;
- Non-indicator ones, on the contrary, use other methods of determining entry and exit points (for example, the indicator of candlestick patterns, or Japanese candlesticks analysis).
In this section, we will discuss some strategies that use indicators to analyze the market and get signals.
Trend-based strategies are the simplest and most accessible to all traders, especially beginners.
However, there are a few important rules to keep in mind when using trend-based trading algorithms:
- You should apply no more than 2-3 indicators at once;
- In addition to trend indicators, you should use oscillators;
- You should refrain from trading during news releases.
When developing a strategy and before applying it in a live account, traders are recommended to use a strategy tester. Besides, you can also test a strategy in a demo account.
Testing a strategy will allow you to see its shortcomings and correct them without losing your deposit.
Automated best Forex Indicators
At present, it is quite easy to use indicators since all the calculations are carried out by a computer program according to a given algorithm.
However, there is a way to use computer programs even more effectively. You can trade with their help. Programs that are used to automate your trades are called trading robots or advisors, depending on the amount of work.
Advisors are semi-automatic robots that perform only comprehensive market analysis based on the program embedded in them. Then they give a signal to a trader who manually makes trades.
Fully automatic programs perform market analysis as well as open and close trades. When using such bots, the participation of a trader is not required.
No matter how attractive fully automated programs may seem, experienced traders still do not recommend shifting all the responsibility onto them.
Bots can analyze the market much faster and more efficiently than humans as they can process large amounts of information in a matter of seconds.
In addition, they are not affected by stress and emotions, do not get tired, and can trade for days on end.
At the same time, like indicators, trading bots are not able to assess the impact of global political or economic factors on the market.
At the moment when the market situation changes amid any important news releases, robots keep trading in the same mode, according to their software program.
Therefore, it is important to monitor their work and adjust settings in time so as not to suffer losses instead of gaining profits.
Rules for using indicators
As mentioned earlier, indicators are easy to use and can provide some insight into the current market situation. However, you should bear in mind that they cannot predict price movements.
Accordingly, you need to follow a number of rules:
1. Use several indicators at once on one chart. They should complement and filter each other's readings.
2. Do not put too many indicators on one chart. Three-four indicators are enough, while ten indicators on one chart will make you confused.
3. Learn the Support and Resistance indicator for MT4. This is a basic tool for all traders with no exception.
4. Use indicators from different categories. For example, trend indicators should be supplemented with oscillators. They work great together.
5. In addition to indicators, pay attention to the price chart itself. You can notice patterns indicating a continued move or a trend change. For instance, Wolfe Waves are wedge patterns composed of several lines headed in different directions.
6. Study the algorithms of the indicators that you are going to use. You need to understand the principle of their work and learn how to customize them.
7. Configure your user interface: choose the font size and colors you feel comfortable working with.
8. Remember that all indicators analyze the market on the basis of past quotes. They do not predict future moves.
9. Conduct fundamental analysis since indicators do not take into account news releases or other political and economic factors.
10. Consider the market situation and use those indicators that produce the best results under given conditions. The market is not always active. There are periods when the market is calm or range-bound.
Conclusion
In this article, we have considered the possibilities of using various technical indicators.
There are a huge number of indicators. Most of them are freely available, while some are paid. Modern trading platforms offer a wide range of built-in analysis tools.
Each indicator is based on a certain algorithm, or a mathematical formula, according to which calculations are made. All calculations are carried out automatically. A trader receives a ready-made solution.
However, it is not that easy. The information coming from indicators may be late, and their signals may be false.
This can be attributed to the fact that indicators perform calculations based on past quotes. Therefore, they can analyze the situation in the past and present but cannot predict the future.
To exclude the impact of these factors, it is necessary to use several trading best Forex indicators at once. Moreover, they must be of different categories.
What is more, fundamental analysis should not be neglected. This type of analysis will help you evaluate the potential impact of global events from the world of economics, politics, and finance on the market.


