


All analytical tools fall into several categories: trend indicators, channel indicators, oscillators, and others. However, the indicators developed by Bill Williams are not included in any of the above groups, as they belong to a separate group.
One of the most famous indicators of Bill Williams is the Awesome Oscillator. Heer we provide a detailed review of this indicator.
If you want to learn more about other indicators, read this article: "Forex indicators".
What is Awesome Oscillator?
As we already mentioned, this indicator was created by Bill Williams. This trader has developed his own trading system based on the theory that the market moves chaotically.
According to this theory, It is rather difficult to deduce any patterns of the market movement, since much depends on psychological factors. Consequently, Williams developed his own tools for market analysis.
All indicators from this group are available for free. For many years of their application, these indicators have repeatedly proven their effectiveness.
One of these tools is the AO indicator. This is an oscillator that makes it possible to identify the strength of the current movement and identify the points of a potential trend reversal on a price chart.
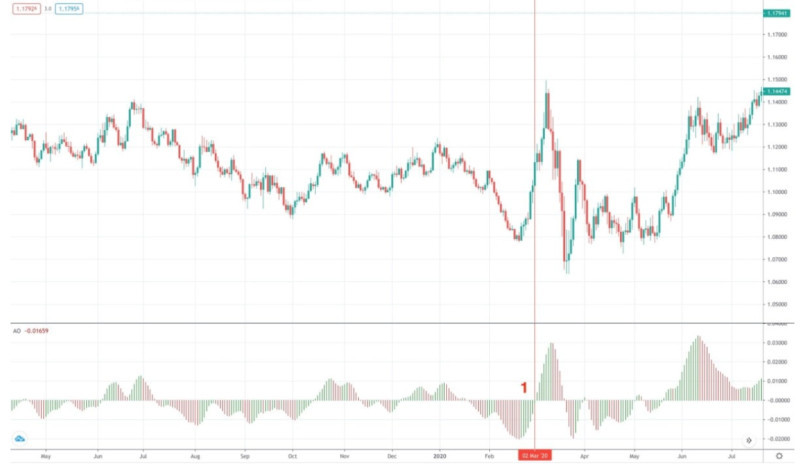
The AO indicator is not added to the main chart but is built as a histogram in a separate window. Histogram bars come in two colors: red and green.
At the same time, the asset price moves relative to the zero mark. It does not have any other levels or marks.
Many traders compare this indicator with the well-known MACD tool. However, there is one significant difference between them: close prices are used for MACD calculation, while average prices are used for Awesome Oscillator.
An average price is the average of the highest and lowest prices. That is, the sum of the highest and lowest readings, divided by 2.
The Awesome Oscillator is based on two moving averages: one with a shorter period (5), and the second with a longer period (34). The difference between these two readings is included in the AO formula.
Pros and Cons
Seemingly, an instrument with such a name - Awesome Oscillator - should have no cons. But in fact, this indicator has its advantages and drawbacks.
The AO advantages are:
- Versatility. This indicator can be used in both stock and currency markets.
- Convenience. The indicator can be found in the set of most trading platforms. So, traders don't need to look for it somewhere else, it is available for use, including the mobile version.
- Sustainable signals. This is a very important parameter for any trader, as the indicator gives specific signals that do not disappear after a while.
- Efficiency. As part of the Williams strategy, the AO indicator has proven its effectiveness in practice and gives good results when used in trading.
- Self-sufficiency. This indicator independently investigates and analyzes various aspects of the price movement in the market. Therefore, traders don't have to use any additional analytical tools.
And here are some of the AO drawbacks:
- Lagging signals. Being an oscillator, the AO indicator is not supposed to lag, but in reality, it does. There can be a delay in signals from it.
- Non-customazable. Those who use the AO indicator cannot change any of the settings put into it by the developer. It can only be used with the options it has.
- False signals on short timeframes. When using this indicator in small time frames, traders can get too much noise, as a result of which false signals appear. Therefore, intraday traders rarely use the AO indicator.
Awesome Oscillator setting
As mentioned above, the AO indicator is the base analysis tool available for installing on all modern trading platforms.
The algorithm of the AO indicator does not allow its users to change its settings. This is both an advantage and a drawback of this indicator.
This is an advantage, as there is no need to reconfigure the indicator for different markets and different trading assets. This is very convenient feature, especially for beginners.
However, it is also a drawback, as the indicator lacks flexibility that is essential to some traders.
However, some parameters of this indicator can still be configured and changed. Let's see which ones.
It should be as convenient as possible for a trader to use the indicator. For this purpose, the chart of the Awesome Oscillator is located in a separate window but not embedded on a price chart.
Besides, users can customize the visual component . That is, it is possible to choose the color and width of the histogram columns for the most comfortable work.
At the same time, it is better to set a contrasting color for the columns so that they differ from each other as much as possible and allow users to clearly see the trend change. In the default settings, red and green colors are used.
Additionally, the standard settings imply only zero level. However, users can independently add additional levels and use them to receive signals from the Awesome Oscillator.
As already mentioned, the AO indicator is universal, as it can be used in any time frames.
It should be noted however, that the bigger the time frame is, the smaller number of signals the indicator produces. At the same time, such signals are considered more accurate.
On smaller time frames, there are significantly more signals. However, many of them may turn out to be false due to the "noise" in short time intervals.
AO indicator signals
Similar to any other indicator, traders use the Awesome Oscillator to have a clear understanding of when the best moment to enter a position is created. This indicator gives a number of signs to open buy or sell deals.
1. One of the most famous signals of this indicator is the "saucer". This pattern is formed when at least 3 bars are completed. The saucer may signal either buying or selling opportunities.
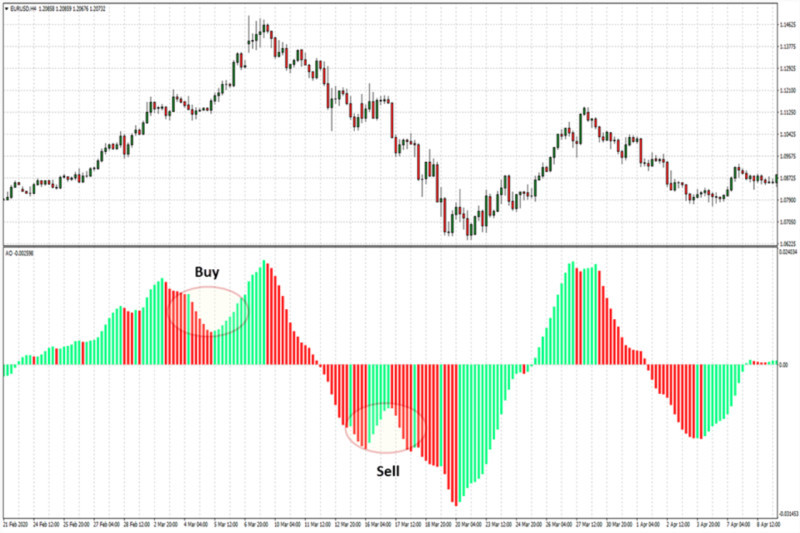
When the AO chart is above the zero level, it is a buy signal. In such a case, a downward trend reverses into an upward one. The second red bar is below the first one, while the third green bar is above the second one.
The sell signals appears when the AO histogram is below the zero level while an upward trend turns into a downward one. The second green bar is above the first one, while the third red bar is below the second one.
2. The second well-know signal is when the zero level is crossed. This signal is rather simple.
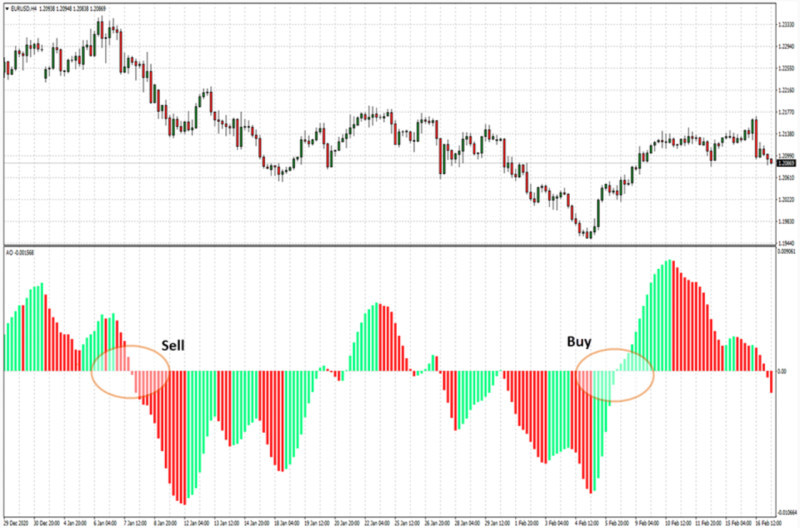
If the price line breaks through the zero level from the bottom up, then it is a buy signal. When the price crosses the zero mark from top to bottom, this indicates a selling opportunity.
3. The Two Peaks is another significant pattern. It is formed when two price peaks appear either below the zero level or above it.
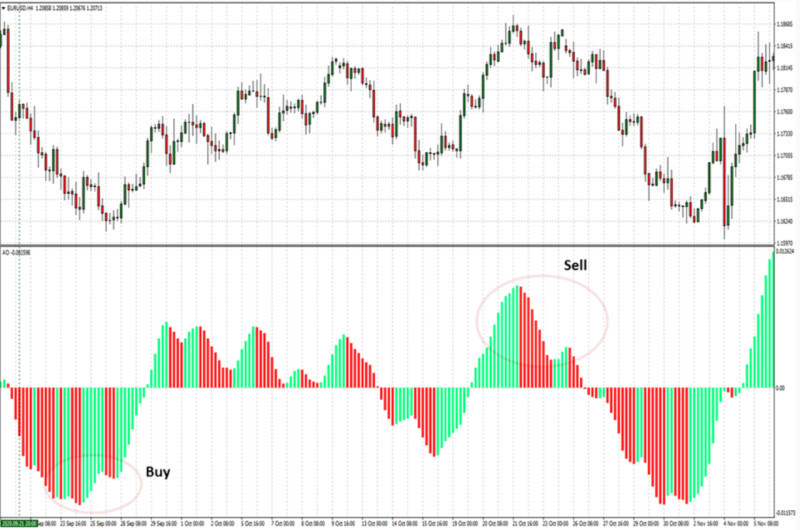
A signal to open a buy position is the appearance of two peaks below the zero level. In this case, the second peak should be higher than the first one, that is, be closer to the zero level. The control column should be green.
If the price breaks through the zero level between two peaks, this pattern becomes invalid. It is better to stick to the second scheme discussed above.
The sell signal is when two peaks are formed above the zero level where the second peak is below the zero level, i.e. closer to it. The control column should be red.
If theprice breaks through the zero level between two peaks, this pattern becomes invalid. But its signal can be used according to the second scheme discussed above.
How to use Awesome Oscillator
As already mentioned, the Awesome Oscillator is calculated based on two main parameters: the moving average 5 (a short one) and the moving average 34 (a long one).
The AO indicator determines the strength of the final 5 candles on the chart and compares it with the strength of the previous 34 candles. Based on the result of this comparison, a histogram is built, which consists of columns of two colors.
A green column is always higher than the column that precedes it, regardless of its color. Therefore, when several green columns form in a row, each subsequent one forms a new high.
The red column is always lower than the previous one. Therefore, when several red columns are formed in a row, each subsequent one appears lower and lower.
Green columns indicate that the indicator along with the price are growing, and there is an opportunity to open a buy position.
When a green column appears on the histogram, it means there are no selling opportunities.
If red columns appear, it means that the indicator and the price are decreasing, so it is reasonable to open a sell position.
When a red bar forms on the histogram, this indicates that there is no sign to buy.
Moreover, if a sell or buy signal appears before the current candle crosses it, and the next column changes color, then this signal becomes false.
The AO indicators works well in combination with other indicators of this category, as they are components of one trading system.
Trading strategies
A trading strategy developed in accordance with the rules helps a trader to make fewer losing and more successful trades. It enables traders to keep calm and avoid trading under the influence of emotions.
As we have already mentioned, the AO indicator is self-sufficient. It means that it is possible to build a trading algorithm based on this single indicator.
At the same time, even novice traders can use AO in their systems, since the settings embedded in its algorithm do not need to be changed.
If the strategy is built on the basis of one given instrument, then it uses the rules for receiving signals to buy or sell, described above.
Specifically, traders look for “saucer” or “two peaks” patterns or wait until the price breaks through the zero level.
Another strategy based on this indicator alone is the search for divergences. However, this algorithm requires putting two additional levels on the instrument chart: 0.005 and -0.005.
In such a situation, a sign to open a buy position becomes the position of the histogram above the new mark (0.005) and the appearance of two red columns in a row.
At the same time, the sell signal is formed when the histogram goes below the -0.005 mark and two green columns following one after another appear.
In addition to using the AO indicator as the main and only tool of the trading system, it can also be used in combination with other indicators to confirm and filter signals.
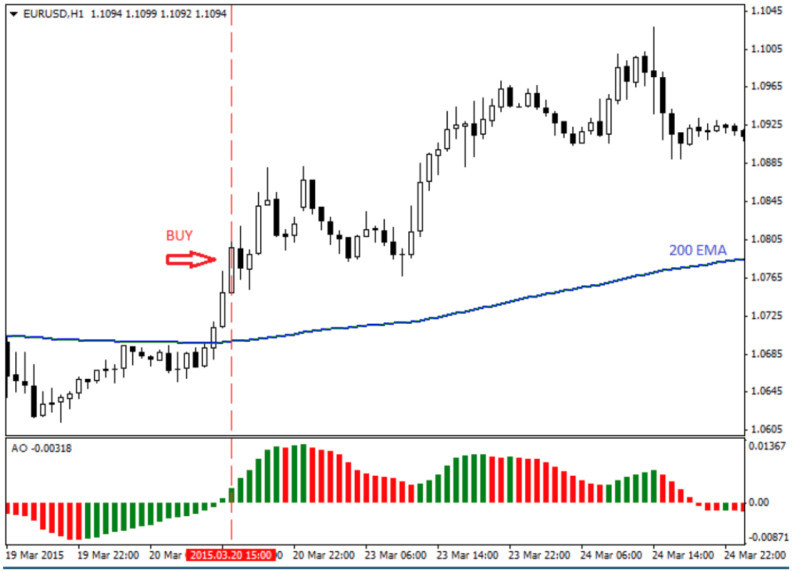
In particular, the combination of the Awesome Oscillator with the EMA trend indicator gives good results. When used together, the trend indicator reveals the rate of movement of the asset's value, while the oscillator is used to search for correction points.
The AO indicator and Fibonacci levels also work well in tandem. The combination of these tools helps traders determine the entry points.
Another effecient combination is the use of two indicators by Bill Williams (AO + Accelerator Oscillator). With the help of the first one, enrty points can be found, while the second one reveals the trend direction.
Divergences and convergences
Another use case of the AO indicator is the search for divergences and convergences.
Divergences mean discrepancies in the readings of the asset price and the graph of the AO indicator.
For example, such a discrepancy occurs when the price chart shows a new peak above the previous one while the indicator histogram displays the next peak lower than the previous one.
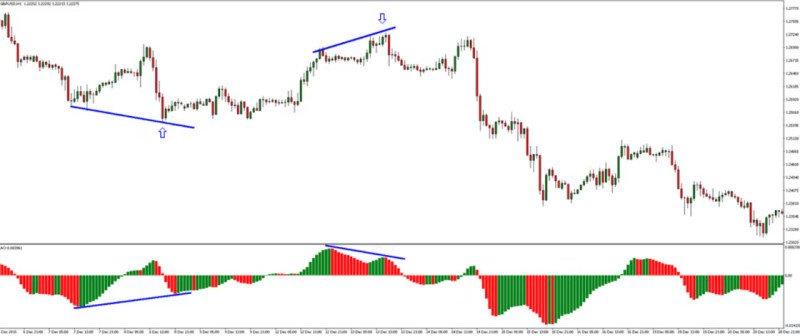
If you connect these points on the price chart and the AO histogram with lines, the resulting lines will be differently directed. This is the main sign of divergence, indicating the end of an uptrend.
At the same time, the lines on the charts should be located strictly under each other, that is, they should appear simultaneously on both charts.
The Awesome Oscillator Divergence indicator has been developed for this purpose. It enables traders to receive signals about divergences and potential reversal points.
This indicator is universal and applicable in any markets, timeframes, and with any assets. At the same time, it is not built into trading platforms; you need to download and install it yourself.
The signals of this tool look like arrows. An upward arrow means a buy signal, while a downward arrow signals a selling opportunity.
At the same time, this indicator searches for divergence in automatic mode, you only need to drag it onto a chart.
Convergence occurs when a new low is formed on the price chart, which is lower than the previous one. Besides, the AO chart displays a low, which is higher than the previous one.
In this case, the lines drawn between these points on both charts move in the direction of their intersection.
This picture indicates the end of the downtrend, that is, traders need to look for the moments of opening buy deals or close previously opened sell deals.
Awesome Oscillator vs MACD
This article has already mentioned that the AO indicator is often compared to the MACD, since they have many common features. However, they also have a number of differences. Let's take a closer look at how they are similar and how they differ.
Both tools are of the same category of technical indicators – oscillators.
Charts of both analytical indicators are built in a window separate from the main chart.
The similarity of these indicators is that they both identify the direction and strength of a trend, as well as potential reversal points.
Besides, they are calculated using a similar formula, where the difference between two EMAs with different periods is factored in. At the same time, in the Awesome Oscillator formula, the period values are fixed at 5 and 34.
The standard MACD formula uses periods of 26 and 12, but these parameters can be changed and reconfigured depending on which market and for which asset they are used.
Another difference, mentioned above, is that MACD is calculated based on close prices, while AO is calculated based on average prices, i.e. the average value between the highest and lowest price.
MACD and AO also differ in the way their charts look like. The Awesome Oscillator chart is plotted as a histogram consisting of red and green columns.
At the same time, the charts of both indicators move relative to the zero level, and when this line is crossed, it serves as a signal to open a trade.
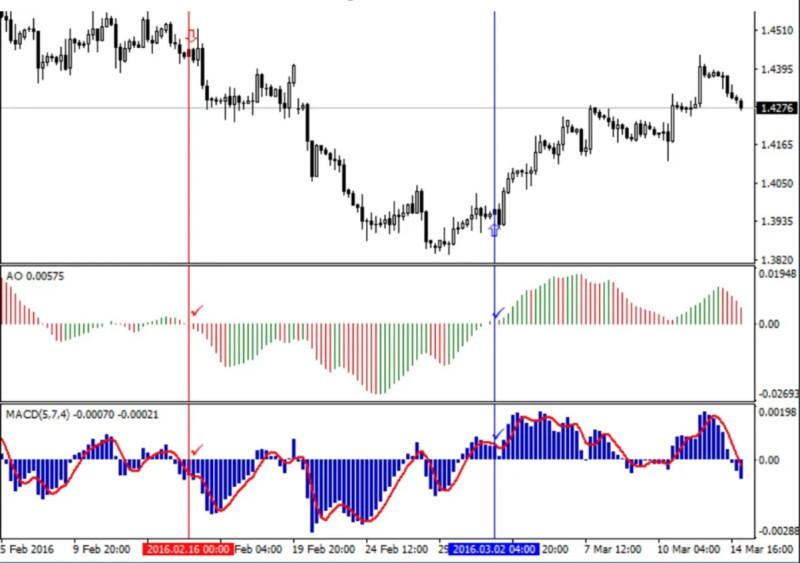
Both these indicators can be used for the analysis of the same price chart. Signals to open trades may come from the MACD and be confirmed by the Awesome Oscillator.
Automation
Traders and programmers often team up to get a more efficient trading result. Traders develop trading systems, while the programmers create trading robots based on them.
The strategy that fully corresponds to all the parameters and preferences of a particular user works most effectively. The best option is when users create and customize it on their own.
When traders see that they have a reliable working algorithm, they understand that such an algorithm can work independently.
In this case, users can seek help from programmers who can easily develop a computer program that can work in automatic mode.
At the same time, trading robots can act as advisors, that is, perform complete analysis of the current situation and give signals to open deals. However, users open trades themselves.
There is another kind of trading bots: fully automated robots that both perform market analysis and make transactions automatically without the participation of a trader.
Which type of a bot to choose depends on every trader individually. However, most experienced traders agree that the work of a bot should be controlled and adjusted when necessary.
Indicators developed by the Bill Williams are quite difficult to automate. However, automated strategies based on them already exist and are widely used by traders.
Moreover, in most cases, trading strategies include indicators not only of this category, but also trend or channel indicators.
So, an effecient strategy can be fully or partially automated. In this case, you can spend the free time on other more complex tasks.
Basic principles of use
For the most effective operation of the AO indicator, you need to follow some simple rules. Here they are:
- Always pay attention to market conditions. Use AO when there is a definite movement in the market.
- No indicator, whatever good it is, can be 100% perfect. From time to time, all indicators lag and fail. Therefore, traders need to use several indicators in combination.
- The Awesome Oscillator can be combined with with trend indicators such as the EMA, as well as Fibonacci levels and indicators of the same category such as the Accelerator Oscillator.
- It is especially important to use trend indicators when there are sharp changes in the market. For example, news releases can contribute to this. AO may respond to such drastic changes not quite adequately and give false signals.
- This indicator can be used in any time frames. In bigger time frames, the number of signals decreases, but they become more accurate. In smaller time frames, the number of signals increases, but they become less reliable.
- It is impossible to change the settings of this indicator, which is both its plus and minus. On the one hand, you do not need to constantly reconfigure it for different assets and markets. On the other hand, the indicator lacks flexibility.
- At the same time, some tools that are created on the basis of this indicator enable their users to change the settings and set other values of the periods. But if these settings are changed, the Awesome Oscillator will lose its initial features.
- Look for divergences and convergences between the readings on the main chart and the AO chart. Divergence indicates the end of an uptrend, while convergence indicates the end of a downtrend. Note that the lines should be strictly under each other.
- Stick to the money management rule: do not use more than 2% of the total capital for one transaction. This will allow you to have a stable income and avoid big losses.
- Follow the rules of your trading strategy. If you received a signal to open a buy or sell deal, then you need to do it. Even if some of the trades turn out to be unprofitable, strict adherence to the strategy will eventually lead to positive results and will lead to a positive balance on your trading account.
Conclusion
In this article, we reviewed Awesome Oscillator, a rather interesting and easy-to-use analytical tool. It's not perfect, but it still has more pros than cons.
Over the years of its use, it has proven its effectiveness and has taken its place in the standard sets of indicators of the most popular trading platforms.
This indicator provides three key types of signals. You can also receive signals by searching for discrepancies between the situation on the price chart and the AO chart.
If you want to receive more signals from this instrument, use it on smaller timeframes. But you need to keep it in mind that many of these signals may turn out to be false.
On bigger timeframes, the number of signals is significantly lower. However, they can be expected to be more accurate and reliable.
Although this indicator is self-sufficient, it is recommended to use it in combination with other tools. This way, traders can confirm or filter out its signals.
A trading system developed on the basis of the AO indicator can be automated. In such a case, a trading bot can do the most difficult part of the job for you.
Read more
Bollinger Bands: strategy and way of use
MFI Indicator (Money Flow Index): complete guide
Support and Resistance Indicator MT4, MT5
VWAP Indicator (Volume Weighted Average Price)
MT4 indicators: how to install and use
Candlestick patterns Indicator for MT4, MT5
Forex volume indicators for MT4, MT5
Forex arrow indicators for MT4


