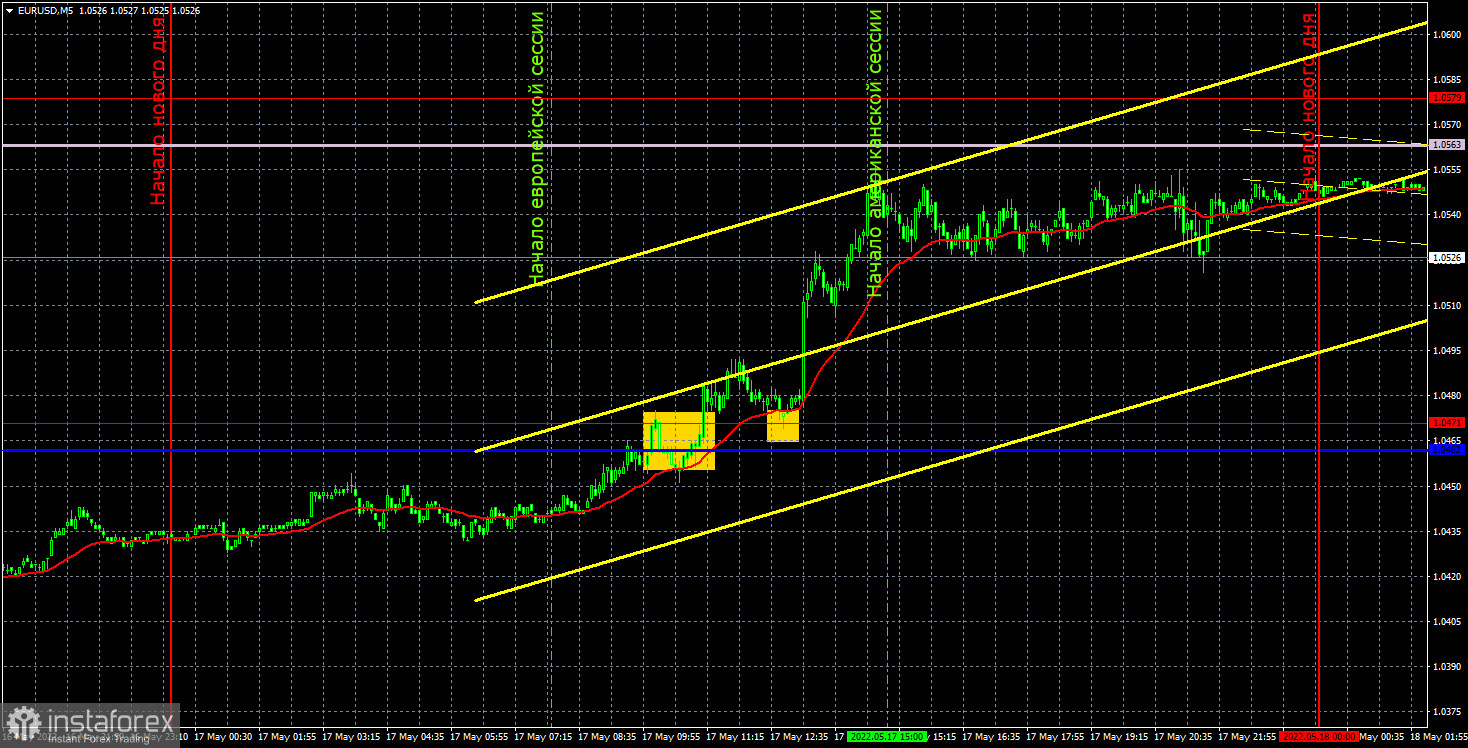
EUR/USD 5M
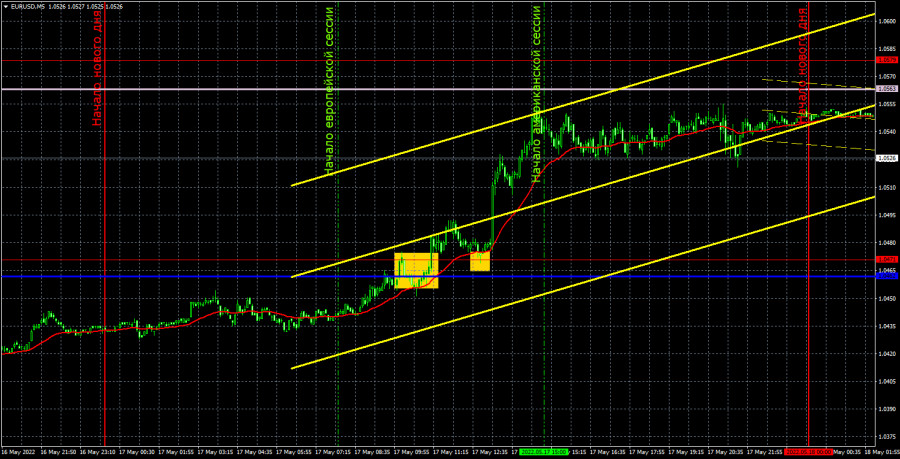
Yesterday, the EUR/USD pair finally showed the movement that had been expected from it for a long time. We said that now the only factor that supports the euro's growth is the technical factor. The pair cannot move constantly in only one direction without corrections. And in recent weeks, that's exactly what it's been doing. Therefore, the correction, as they say, was brewing. And so it began. Formally yesterday, traders had macroeconomic grounds for buying the euro. In the morning, the report on GDP for the first quarter was released in the second estimate, which exceeded the value of the first estimate by 0.1%. However, economic growth at the beginning of this year is still weak - only +0.3% Q/Q. We believe that such figures could not provoke the euro's growth by 100 points. Meanwhile, this growth was shown. However, the euro is already facing a serious problem. Firstly, the pair now needs to overcome the important Senkou Span B line. Secondly, update its recent local highs near the levels of 1.0579 and 1.0637. Without this, further march to the upside will be impossible.
Trading signals on Tuesday were, and they were very good. A signal to buy was formed at the beginning of the European trading session when the critical line and the extreme level of 1.0471 were overcome. A little later, another buy signal was formed on a rebound from the level of 1.0471. Thus, traders could open long positions. Subsequently, the pair went up by about 60 points and this is how much traders could earn on this deal.
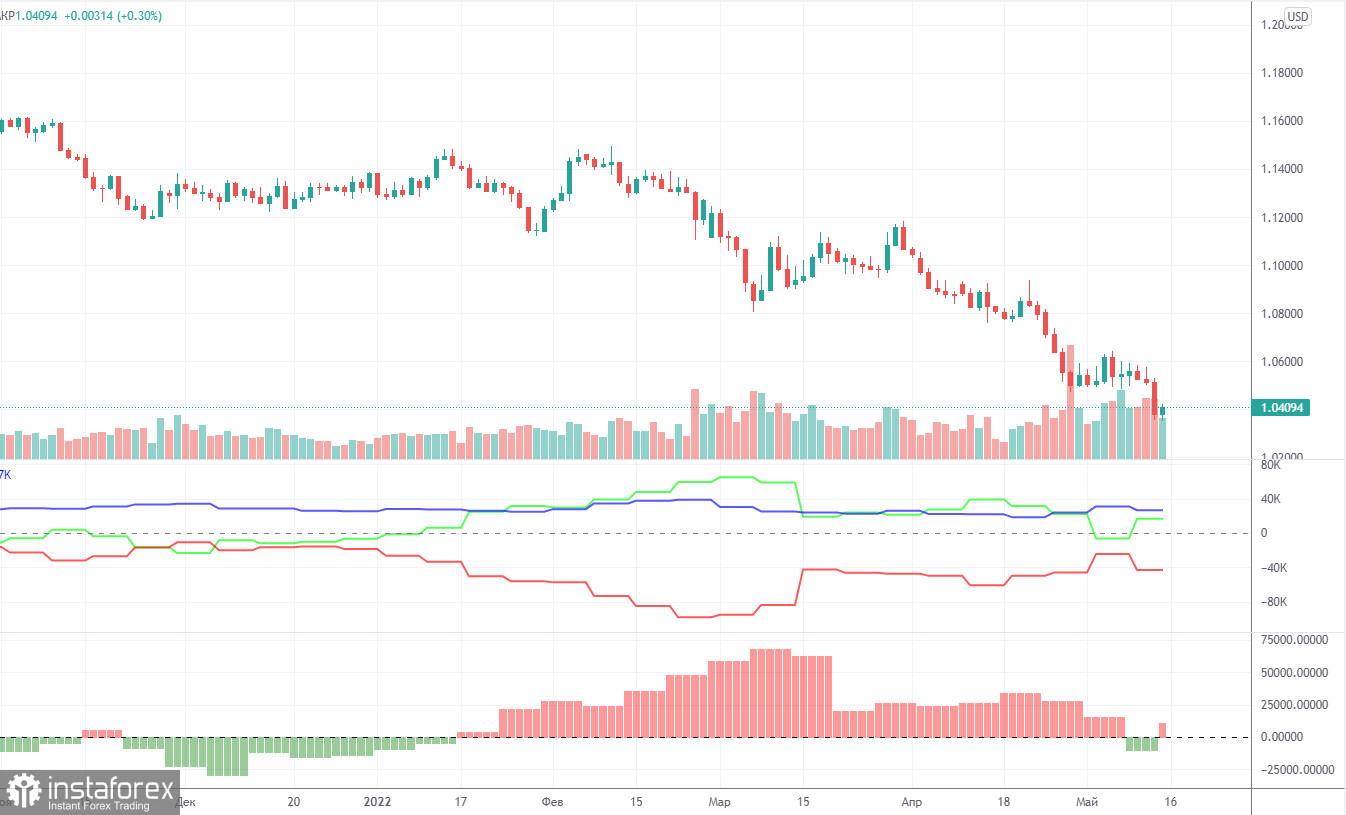
COT report:
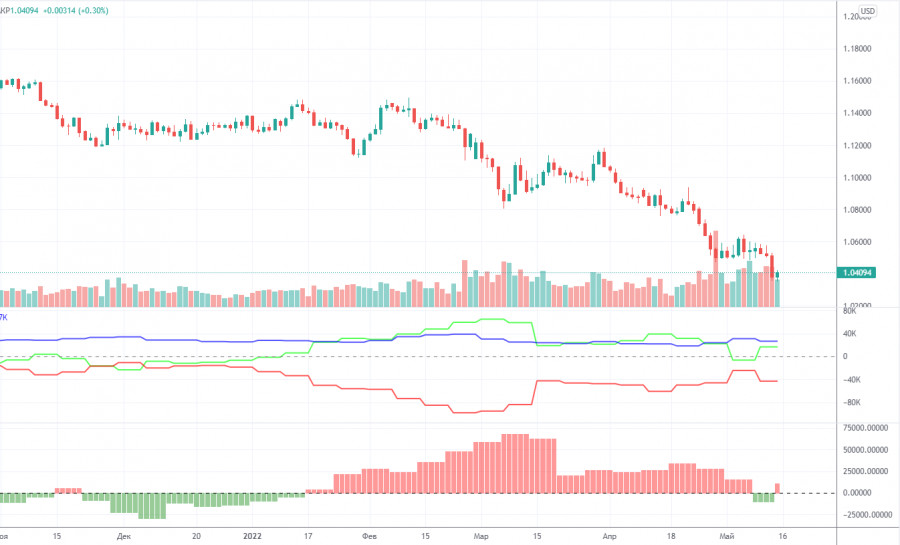
The latest Commitment of Traders (COT) reports on the euro raised more questions than they answered! The week before last, for the first time in a long time, the COT report showed a bearish mood among traders, which is logical, given the strong fall of the euro in recent months. However, the new COT report again showed an increase in bullish sentiment! During the reporting week, the number of long positions increased by 19,800, while the number of short positions in the non-commercial group decreased by 3,100. Thus, the net position grew by 23,000 positions per week. This means that the bearish mood has turned to bullish, as the number of longs now exceeds the number of shorts for non-commercial traders by 17,000. As a result, we again have a paradoxical picture in which big players buy more euros than they sell, but at the same time, the euro falls. From our point of view, this is because the demand for the US dollar is much higher than the demand for the euro. Even if someone suggested that the whole point is the weakening of the bullish mood in recent months (the second indicator is a histogram), then we recall that in the week between May 4 and 10, commercial traders opened 20,000 longs, and the euro increased by 30 points over the same period... Thus, it is still impossible to make a correlation between COT reports and what is happening in the market. Forecasts to build on such data, moreover, do not make sense.
We recommend to familiarize yourself with:
Overview of the EUR/USD pair. May 18. Euro - "resurrection from the dead".
Overview of the GBP/USD pair. May 18. The pound follows the euro. Or vice versa? Has the technical correction begun?
Forecast and trading signals for GBP/USD on May 18. Detailed analysis of the movement of the pair and trading transactions.
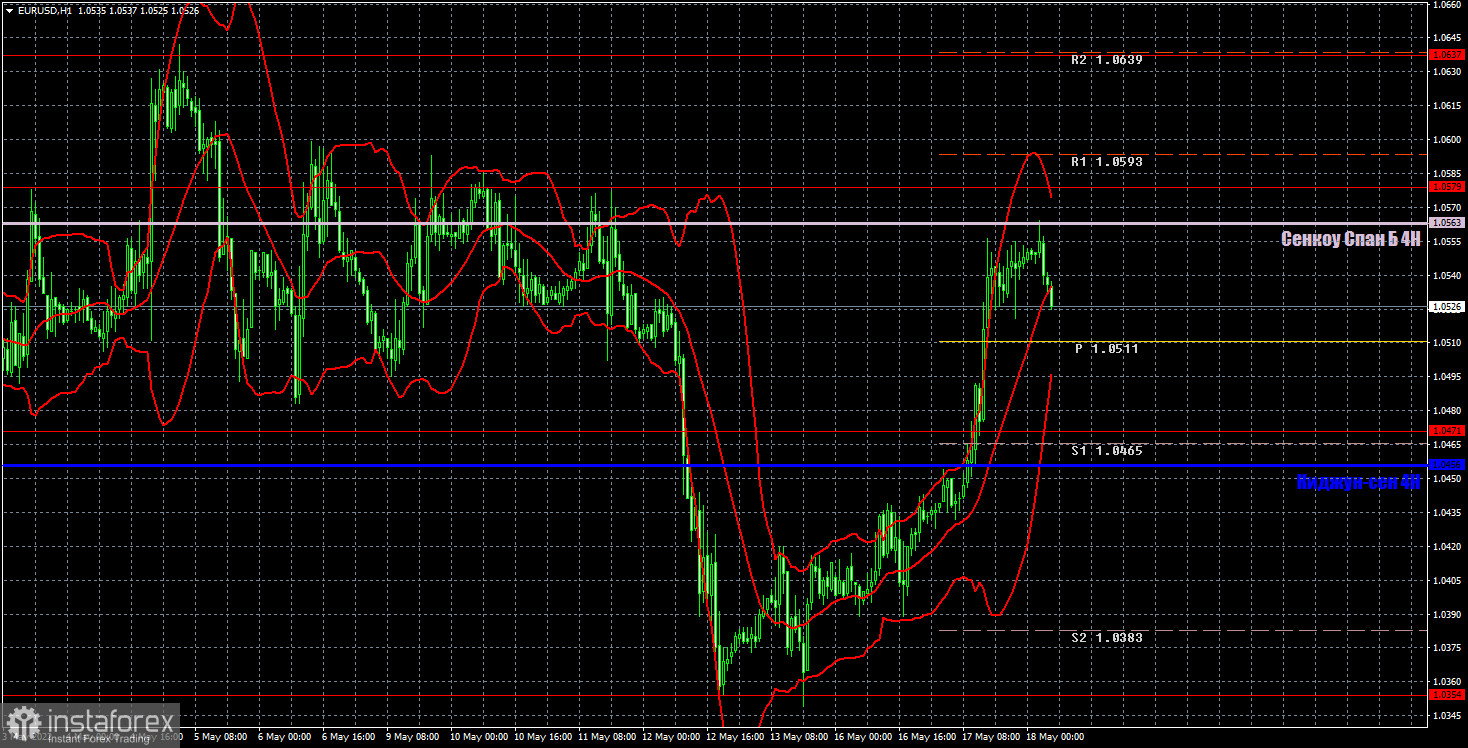
EUR/USD 1H
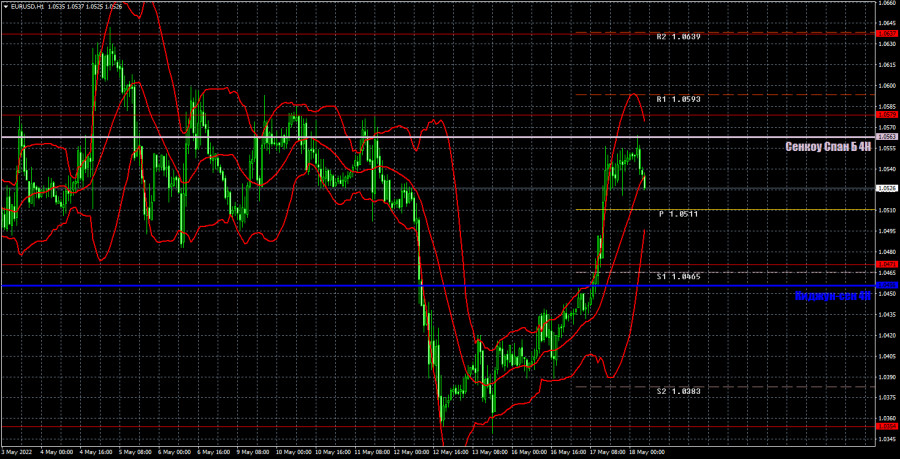
The pair performed a strong growth on the hourly timeframe, but the chart clearly shows that the Senkou Span B line has not been overcome at the moment, the latest local highs have not been updated. Thus, the pair may now resume falling within the ongoing downward trend. We would say this: the probability of the beginning of a new upward trend is now the highest in recent times, but the probability of maintaining a downward trend is also high. We allocate the following levels for trading on Wednesday - 1.0340-1.0354, 1.0471, 1.0579, 1.0637, as well as the Senkou Span B (1.0563) and Kijun-sen (1.0456) lines. Ichimoku indicator lines can move during the day, which should be taken into account when determining trading signals. There are also secondary support and resistance levels, but no signals are formed near them. Signals can be "rebounds" and "breakthrough" extreme levels and lines. Do not forget about placing a Stop Loss order at breakeven if the price has gone in the right direction for 15 points. This will protect you against possible losses if the signal turns out to be false. Today the European Union is set to publish inflation for April in the second assessment. Since this is the second estimate, it is unlikely that the index value will differ much from 7.5%. And it is unlikely that this report will be followed by a strong market reaction. On the other hand, only minor reports on building permits and laying new foundations will be released in the US today.
Explanations for the chart:
Support and Resistance Levels are the levels that serve as targets when buying or selling the pair. You can place Take Profit near these levels.
Kijun-sen and Senkou Span B lines are lines of the Ichimoku indicator transferred to the hourly timeframe from the 4-hour one.
Support and resistance areas are areas from which the price has repeatedly rebounded off.
Yellow lines are trend lines, trend channels and any other technical patterns.
Indicator 1 on the COT charts is the size of the net position of each category of traders.
Indicator 2 on the COT charts is the size of the net position for the non-commercial group.